
Good morning, Mission, and welcome to Virus Village, your (somewhat regular) Covid-19 data dump.
Hospitalizations continue to fall off, along with recorded infections and positivity rates, and R Number models suggest omicron is beating a hasty retreat.
San Francisco’s Department of Public Health announced this morning the lifting of most mask mandates on Feb. 16. As always, it will take time and effort to decipher exactly what this entails. For example, masks will still be required in schools, and there will be no requirement that businesses (particularly restaurants and bars) take any measures to protect their employees. At the same time, “the Health Officers recognize that essential workers and communities of color continue to be highly impacted by Covid-19 and will need additional support to limit widening health disparities.” This acknowledgment makes no mention of what “additional support” they have in mind.
DPH apparently agrees with Dr. Anthony Fauci, who says the country is no longer in the “full-blown” pandemic phase of covid.
Though The Vaccine held up well in preventing hospitalization, it did little (as did prior infection) in the omicron surge to prevent infection, reinfection or transmission of the virus.
This could be a problem as omicron 2.0 gains traction.
In “the next phase,” we are advised to beware of the extremes. We should also be wary of the word “normal” (“old” or “new”) to indicate the goal. The “normal” was, and still is, an expensive, for-profit, racist health care system that denigrates, demeans and defunds public health.
With public officials racing to forget the virus as quickly as possible, the WHO warns against lifting restrictions too soon.
The good news on covid, as usual, leaves out most of the world. Especially when The Vaccine is still pretty much controlled by profit-hungry entities. Although Johnson & Johnson promised to produce and ship one billion doses in 2021, it has so far released about 400,000. Falling out of favor in wealthy countries, but in demand elsewhere, J&J “paused” production in favor of working on a vaccine for an unrelated virus.
In practice, “following the science” has often meant following mostly well-paid, often white male scientists with supersized egos. Perhaps you’ve read about the fall of Biden’s chief science advisor. In this piece, the writer casually mentions racist, misogynist James Watson won a Nobel Prize, as the “co-discoverer of the double-helix structure of DNA”. He forgets to mention that Watson ripped off the discovery first made by a woman, Dr. Rosalind Franklin, who got no credit, and died in obscurity. Her story, a tale of science and scientists, has recently been told in the play Photograph 51.
Scroll down for today’s covid numbers.
The U.S. Centers for Disease Control data used for the chart lags behind the data supplied from the San Francisco Department of Public Health. As of Feb. 8, DPH reports 780,878 residents have been vaccinated, more than 89 percent of all San Francisco residents have received one dose, and over 82 percent have received two. For residents 5 and older, DPH reports the figures rise above 90 percent and above 86 percent while for those 65 and older over 90 percent have received two doses. SFDPH reports that as of Feb. 8, approximately 462,636 SF residents (64 percent of all residents) have received a COVID-19 booster dose.
For information on where to get vaccinated in and around the Mission, visit our Vaccination Page.
On Feb. 5, DPH reports there were 203 covid hospitalizations, or about 23.2 hospitalizations per 100,000 residents (based on an 874,000 population). ICU numbers have fallen off as well. Today, the California Department of Public Health reports 208 covid patients in SF hospitals and 43 ICU patients.
The latest report from the federal Department of Health and Human Services shows Zuckerberg San Francisco General Hospital with 41 covid patients and 6 ICU beds available, while across the Mission, CPMC had 24 covid patients and 2 ICU beds available. Of 262 reported covid patients, 122 were at either SFGH or UCSF, with at least 54 ICU beds available among reporting hospitals (which does not include the Veterans Administration). The California DPH currently reports 74 ICU beds available in San Francisco. Note: The Government Accountability Office (GAO) has issued a scathing report for sustained public health crisis failures at HHS. The failures cited include “collecting and analyzing data to inform decisionmaking.”
Omicron revived SF’s standard pandemic pattern, hitting the lower socioeconomic sectors of the City the hardest. Between Dec.6 and Feb. 4, DPH recorded 4325 new infections among Mission residents or 736 new infections per 10,000 residents. Bayview Hunters Point had the highest number of recorded new infections (4495) with a rate of 1185 new infections per 10,000 residents. Of 38 neighborhoods, 14 had rates above 600 per 10,000 residents, 13 in the east and southeast sectors of the City. Glen Park and Seacliff were the only neighborhoods with less than 1000 recorded infections.
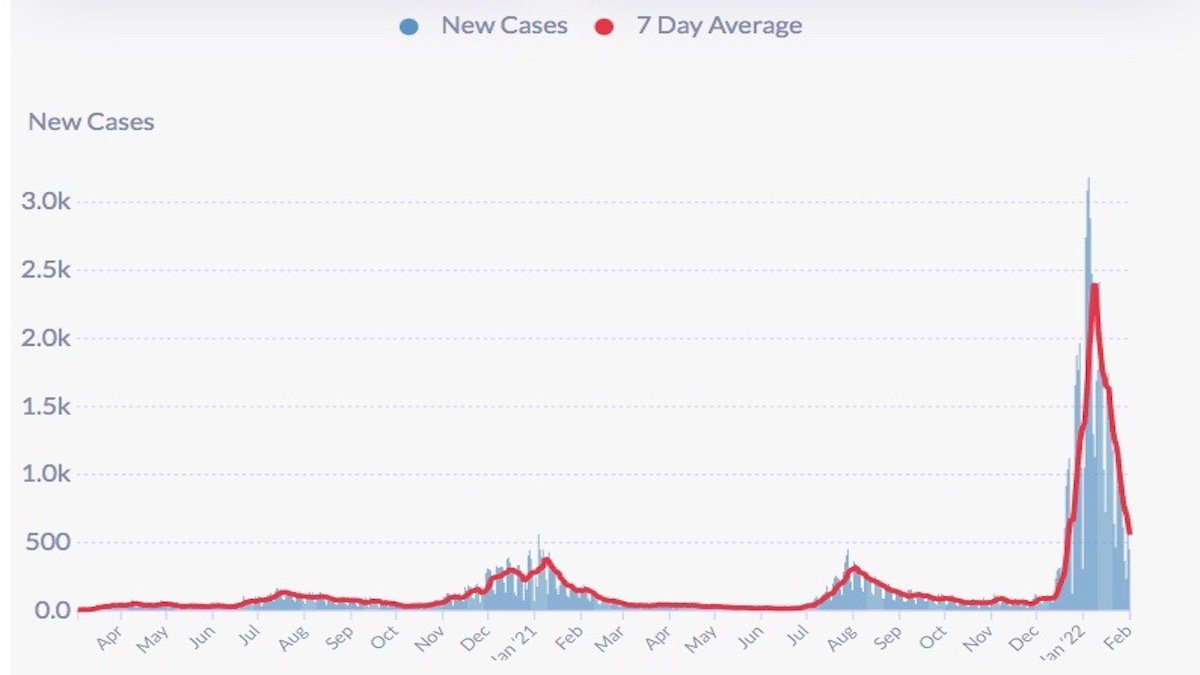
DPH reports on Feb. 1, the 7-day average of daily new infections recorded in the City was 552 (down from a peak of 2238 on Jan. 9) or approximately 63.1 new infections per day per 100,000 residents (based on an 874,000 population). According to DPH, the 7-day average infection rate among vaccinated residents was 54.1 per 100,000 “fully vaccinated” residents and 145.7 per 100,000 unvaccinated residents. It is unclear whether “fully vaccinated” includes boosters or the infection rate among those vaccinated with 2 doses. The New York Times reports that on Feb. 7, the daily average was 455.
For the month of January, Asians had 11,255 recorded infections or 27.5 percent of the month’s total; Latinxs had 9,669 or 23.7 percent, Whites had 9,301 or 22.8 percent, Blacks 2,797 or 6.8 percent, Multi-racials 574 or 1.4 percent, Pacific Islanders 445 or 1.1 percent, and Native Americans had 106 recorded infections or .3 percent of the month’s total.
For the month of January, Latinx San Franciscans had a positivity rate of 25.9 percent, Pacific Islanders 21.7 percent, Blacks 20.7 percent, Native Americans 18.4 percent, Multi-racials 18.2 percent, and White San Franciscans had a January positivity rate of 12.2 percent.
DPH today reports that of Feb. 4, there have been at least 42 covid-related deaths in the City so far in January and 0 so far recorded in Februrary. According to DPH “COVID-19 deaths are suspected to be associated with COVID-19. This means COVID-19 is listed as a cause of death or significant condition on the death certificate.” Using a phrase like “suspected to be associated with” indicates the difficulty in determining a covid death. The ambiguity is heightened when currently it is unknown whether or not 34 percent of the deaths had one or more underlying conditions. As of Feb. 4, only 21 deaths of 734 total are known to have had no underlying conditions, or comorbidities.
Covid R Estimation lowered its San Francisco R Number estimate again to .60 (which is the lowest I can remember), while keeping its California R Number at .64. The ensemble lowered its average San Francisco R Number to .44 its average California R Number to .55. All models reporting SF numbers today in the ensemble are below .5.
For the month of January, San Franciscans aged 0-4 recorded 1,982 infections or 4.8 percent of the January totals; those aged 5-11 had 3,069 infections or 7.5 percent, 12-17 2,807 infections or 6.9 percent, 18-20 1,265 infections or 3.1 percent, 21-24 2,862 infections or 7 percent, 25-29 5,029 infections or 12.3 percent, 30-39 8,936 infections or 21.9 percent, 40-49 5,553 infections or 13.6 percent, 50-59 4,445 infections or 10.9 percent, 60-69 2,816 infections 6.9 percent, 70-79 1,314 infections or 3.2 percent, and those 80 and above had 791 infections or 1.9 percent of the month’s total recorded infections.