
Good morning, Mission, and welcome to Virus Village, your (somewhat regular) Covid-19 data dump.
Getting tired of all the alliteration? You’re not alone. Some experts think it’s a symptom of “too long” covid.
Good News: Real America is done with #Covid19
Bad News: #Covid19 is not done with America (real or unreal).
Over the past few reporting days, there’s been a noticeable falling off in San Francisco hospitalizations, dropping below 100 for the first time in a month.
Nonetheless, so far it appears that, in most of the U.S., the variant is not following the pattern we saw in India or the UK. So it’s reasonable to wonder when will the delta surge end?
To mask or not to mask? That is the question for schools, teachers, students and parents this month. Lately, pro-maskers have gotten an evidentiary boost from a study among villages in Bangladesh. Like many studies, this one has its pros and cons, One thing does seem to stand out, however: whereas surgical maks provided some protection, cloth masks did not. Guess what kind of masks most school kids wear?
Another study, this one in both real and unreal America, show that a fully vaccinated “average American” has about a 1 in 5,000 chance of getting a breakthrough infection. In areas where the prevalence is low, like San Francisco, your odds are even better, like 1 in 10,000
No one disputes the shocking disparities in global access to The Vaccine. Here’s some on the acute lack of supply and delivery in the Global South (AKA “developing” countries).
Scroll down for today’s covid numbers.
The U.S. Centers for Disease Control data used for the chart lags behind the data supplied from the San Francisco Department of Public Health. As of Sept. 7, DPH reports about 79 percent of all San Francisco residents have received one dose, and more than 73 percent are completely vaccinated. Despite the proven protection provided by The Vaccine, the City’s unvaccinated have not been moved in great numbers to get the jab. On Sept. 7, the seven-day rolling average of shots per day was 339. For information on where to get vaccinated in and around the Mission, visit our Vaccination Page.
On Sept. 4, DPH reports there were 89 hospitalizations (a drop of 12 in three days), 64 in acute care, 25 in the ICU. The latest update from DPH says 73 fully vaccinated San Franciscans have been hospitalized (a rate of 14.5 per 1,000 cases compared to 76.6 per 1,000 cases for those not fully vaccinated) . According to the CDC, there were 53 new admissions for the week ending Sept. 6 (a 15.87 drop over the previous week). For the week ending Sept. 6, covid patients accounted for 5.23 percent of hospital beds (-.058 from previous week) and 11.48 percent of ICU beds (-2.1 from previous week ). As of Aug. 30, the CDC says that, of 173 million vaccinated U.S. residents, 12,908 patients with a Covid-19 vaccine breakthrough infection were hospitalized or died. Of that number, 25 percent either had no covid symptoms, or their hospitalization or death was not covid-related.
The latest report from the federal Department of Health and Human Services shows SFGH with 23 covid patients and 83 percent ICU occupancy, while across the Mission, CPMC had 16 covid patients and 84 percent ICU occupancy. Of 113 reported covid patients, 59 were at either SFGH or UCSF.
Between July 5 and Sept. 3, DPH reported 797 new cases among Mission residents (or 136 new cases per 10,000 residents) and 929 new cases in Bayview Hunters Point (245 new cases per 10,000 residents). During this period, 22 neighborhoods had case rates of over 100 per 10,000 residents. Bayview Hunters Point is the only neighborhood with a rate in excess of 200 per 10,000 residents.
DPH reports for the week ending Aug. 31, the seven-day rolling average of daily new cases in the city was 124 new cases, or approximately 13.8 new cases per day per 100,000 residents (based on an 896,000 population). Although one reader believes DPH reports case numbers for vaccinated and unvaccinated, I have yet to find those numbers. What I have found is that DPH reports the infection rates for vaccinated and unvaccinated more or less weekly. On Aug. 27, the 7-day average case rate among fully vaccinated residents was 10.2 per 100,000 residents and for unvaccinated the rate was 28 per 100,000.
For the month of August, White San Franciscans had 2,003 positive tests, Latinxs 1,212, Asians 944, Blacks 701, Multi-racials 102, Pacific Islanders 95 and Native Americans had 20 positive tests. All groups had higher numbers in August than july, with Whites having the biggest jump.
For the month of August, Latinx residents had a positivity rate of 7.0 percent, Pacific Islanders 6.6 percent, Blacks 6.3 percent, Native Americans 4.3 percent, Whites 3.6 percent, Multi-racials 2.4 percent and Asians 2.3 percent. Only Native Americans and Multi-racials had higher positivity rates in August than September.
Covid-related deaths in San Francisco are always difficult to ascertain. Now DPH reports 19 August deaths, bringing the covid-related death toll to 592. DPH provides no demographic data for monthly deaths, but reports that, as of Aug. 30, 6 of all covid-related deaths were among those fully vaccinated.
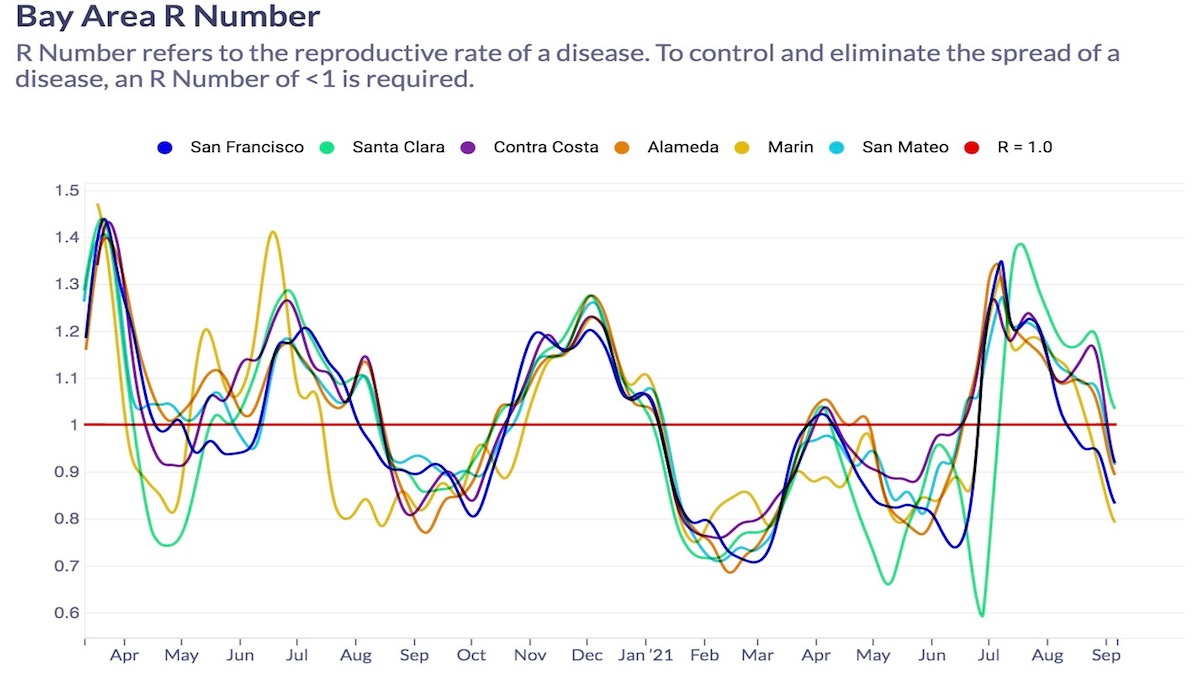
Despite Delta’s high transmissibility, R Number estimates have begun to approach where they were pre-Delta. Covid R Estimation lowered its estimate for the San Francisco R Number to .83 and its estimate for the California R number to .95. All but one model in the ensemble estimate the San Francisco R Number below 1, with an average of .86, while the average California R Number is .89. The ensemble average estimate for San Francisco has been below 1 since Aug. 3.
For the month of August, San Franciso residents 0-4 had 3.1 percent of the new cases, 5-10 5.1 percent, 11-13 2.3 percent, 14-17 2.4 percent, 18-20 2.7 percent, 21-24 8.4 percent, 25-29 15.6 percent, 30-39 24.5 percent, 40-49 13.8 percent, 50-59 10.7 percent, 60-69 6.4 percent, 70-79 3.4 percent, and those 80 and over had 1.7 percent of the new cases.
Thank you, John. Very helpful.
I recreated the SFDPH webpage with the missing “New cases by vaccination status” data. I used the source from the Wayback machine and a free hosting site. The Power BI visualization and data are still active but just not linked on the SFDPH page.
Scroll down this page to view the viz/data, https://sfdph-deleted.000webhostapp.com/ .
Mark,
I think I’m the reader you are referring to. It looks like the SFDPH removed the “New cases by vaccination status” data from the website. You can see it was there via the Internet Archive (WayBack Machine) , https://web.archive.org/web/20210904063429/https://sf.gov/data/covid-19-cases-and-deaths (It was removed sometime on 9/7/2021 and only up for a few days). Maybe you can ask the SFDPH why it was removed.
I did copy down the rates for the last day that was reported (9/1/2021) , the 7-day cases/100K rate for vaccinated was 8.0, and for unvaccinated it was 29.5 . The removed data/graph had data starting in Dec/Jan when vaccines were available.
> On Aug. 27, the 7-day average case rate among fully vaccinated residents was 10.2 per 100,000 residents and for unvaccinated the rate was 28 per 100,000.
I am surprised the two numbers are so close.
Is there an explanation for that (given how it’s been said again and again this is a pandemic of the unvaxxed?)
@Jerry, the infection rate of unvaccinated is nearly 3 times as high as the unvaccinated. The difference in hospitalization rate is even higher.