
Over 1,000 ICE arrests took place in and around San Francisco between January 20 and October 15, 2025, data shows. A new analysis suggests that at least half of the arrests that occurred locally happened at routine immigration appointments inside private ICE field offices and, unlike the courthouse arrests, hidden from public scrutiny.
There were 539 arrests at immigration appointments, and 193 arrests likely in the community, often in the street, or outside of people’s home or workplace. Another 147 arrests happened in hallways outside of immigration courtrooms.
The findings reveal for the first time the approximate location of most arrests in the San Francisco area, thanks to a new analysis by Joseph Gunther, a mathematician and independent researcher who has been digging deep into ICE and immigration court data over the past year. The data includes arrests from San Francisco proper, San Mateo County, Alameda County, Marin County, and portions of Contra Costa County and Sonoma County.
Gunther’s analysis brings detail to the nature of arrests happening in the San Francisco area, which previously were only understood on a much broader, regional level.
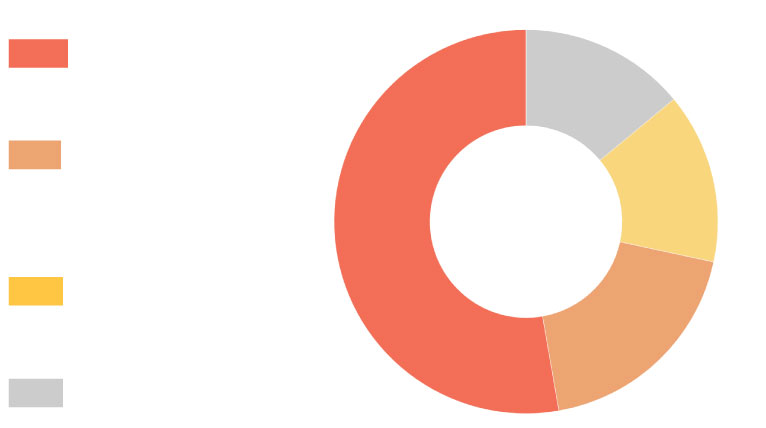
More than half of ICE arrests in S.F. happened at immigration appointments
Arrests, where the person arrested was first detained in downtown San Francisco, by location.
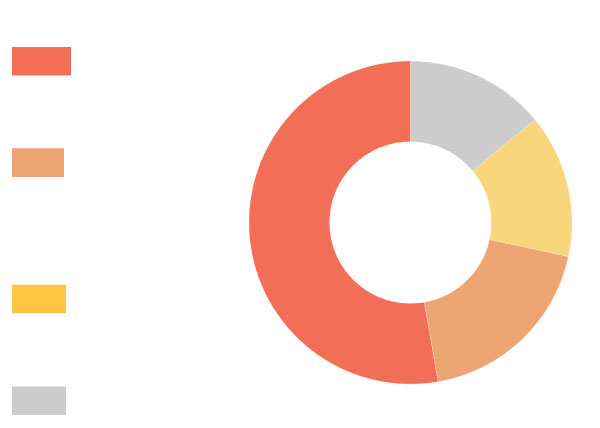
immigration appointments
53%
in the community
19%
immigration
court
14%
other
14%
immigration appointments
53%
in the community
19%
immigration
court
14%
other
14%
Chart by Kelly Waldron. Source: Joseph Gunther. Note: Data covers ICE arrests that occurred between Jan. 20 and Oct. 15 2025 and excludes arrests that appeared to be transfers from criminal custody, or arrests originally made by non-ICE agencies.
To narrow down those arrests, Gunther looked at whether the person made a stop at the short-term ICE facility in downtown San Francisco. In the vast majority of cases, immigrants arrested around the Bay Area are sent to the holding room on the sixth floor before being sent to a longer-term ICE facility, often a few hours away in Bakersfield or McFarland, according to Milli Atkinson, the director of the Immigrant Legal Defense Program at the San Francisco Bar Association.
Immigrants who are seeking legal status, such as asylum, are required to periodically attend routine immigration appointments with an immigration officer at an ICE field office, and in 539 instances between January and October 2025, those appointments led to the immigrants’ arrest. Unlike other arrests that take place at public courthouses or out in neighborhoods, these immigration appointments are held in a private field office. Immigrants are not allowed to bring in a guest, unless it is their attorney. Reporters are not allowed at the meetings.
Atkinson, who has been heavily active at the courthouse organizing pro-bono attorneys of the day, says these numbers are “very much in line with the trends that we saw.”
Unlike other cities where large scale raids have happened, such as Los Angeles or Minneapolis, fewer arrests have happened in public in San Francisco. Those that did happen in public spaces, namely those that happened outside the San Francisco immigration courtrooms, were extensively documented by Mission Local through the summer and fall.
Out of 147 people who were arrested outside of immigration court, only one person had a criminal conviction, a DUI, according to data reviewed by Gunther.
The vast majority of those courthouse arrests (128), were at the immigration court in San Francisco — a number that is confirmed by Mission Local’s reporting and data published by the immigration court. Nineteen arrests were recorded at the immigration court in Concord.
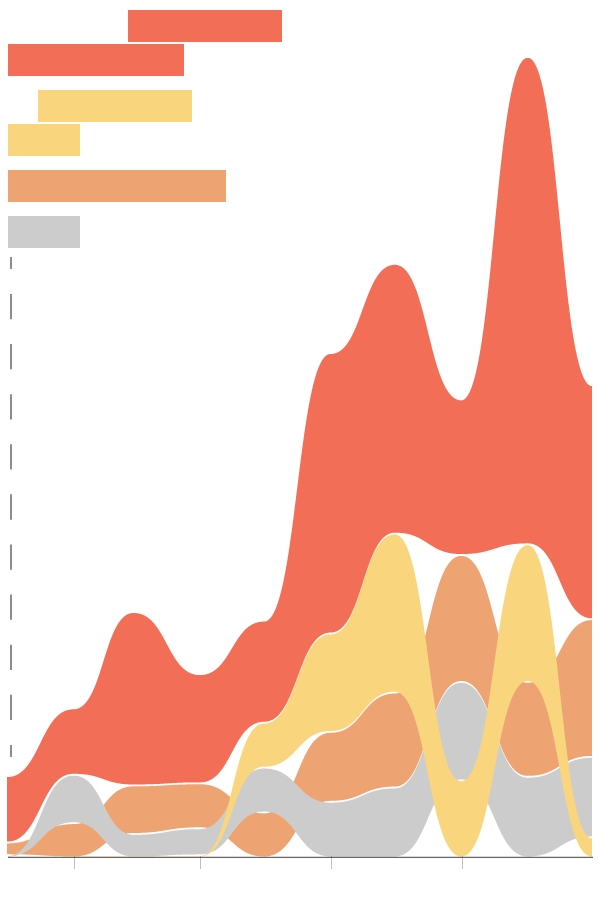
In 2025, most S.F. arrests were at immigration appointments
The number of ICE arrests between January 20 and October 15, 2025, by location.
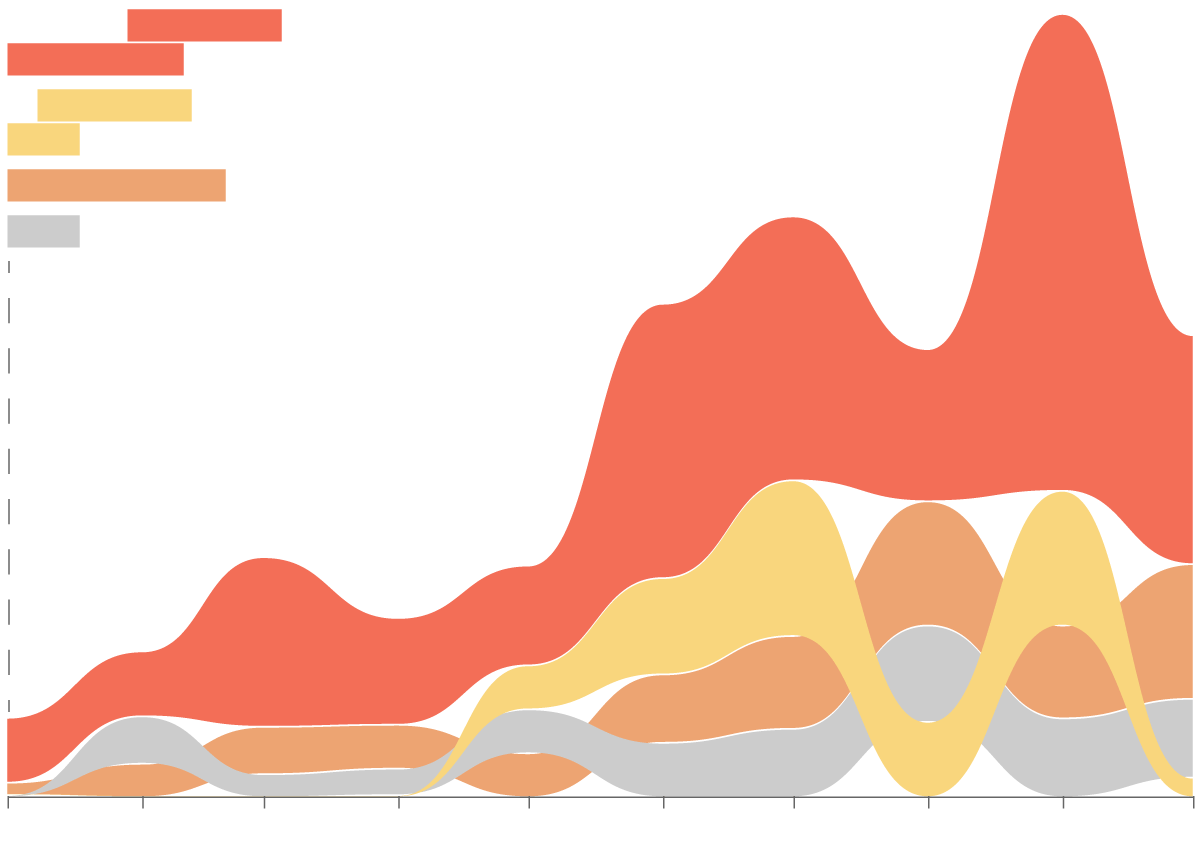
arrests at immigration
appointments
at immigration
court
in the community
other
February
March
April
May
June
July
August
September
arrests at immigration
appointments
at immigration
court
in the community
other
February
April
June
August
Chart by Kelly Waldron. Source: Joseph Gunther. Note: Data includes arrests where someone was first detained in downtown San Francisco and excludes arrests that appeared to be transfers from criminal custody, or arrests originally made by non-ICE agencies.
Around 12 percent of the arrests included in the data analysis were documented in news coverage, or in habeas petitions, which attorneys file to get their clients released after they are arrested. Mission Local reporters read through habeas petitions to understand what these arrests look like.
Here are some of their stories:
Illustrations by Neil Ballard.
Data methodology
Read more about this analysis
The data used in this analysis was obtained through a records request made by the Deportation Data Project, a research group run by professors at U.C. Berkeley. Another dataset, available through the Executive Office for Immigration Review, was used to corroborate the courthouse arrests.
Gunther’s analysis breaks down the total arrests in San Francisco into several categories (check-in arrests, courthouse arrests and community arrests.) The arrests were narrowed down by location by obtaining information for every case where an individual was first taken into custody at the short-term ICE facility downtown, at 630 Sansome Street.
Gunther gathered a sample of known arrests, where the details of where the arrest happened could be verified in habeas petition filings or news clips. That sample represents around 12 percent of the total arrests in and around San Francisco. Gunther was able to use that data sample to understand columns in the master dataset and determine where an arrest likely occurred.
The analysis excludes arrests that appeared to be transfers from criminal custody, or arrests originally made by non-ICE agencies.
A spokesperson for ICE did not endorse nor provide comment on this analysis; they said ICE does not provide granular data on individual arrests. How ICE categorizes arrests appears to vary by jurisdiction and the pattern identified in San Francisco is not necessarily applicable to other jurisdictions.
For around 12 percent of the arrests, how the arrest happened could not be verified or reliably drawn from the data. Those arrests are categorized as “other.”
For more information behind Joseph Gunther’s analysis, visit his website.