
It’s been three weeks since the Nov. 5 election in San Francisco, the votes have all been counted, and we can identify some interesting data tidbits from this year’s races.
We’ve already written about the role that redistricting played this year. Here are some other takeaways.
1. Turnout
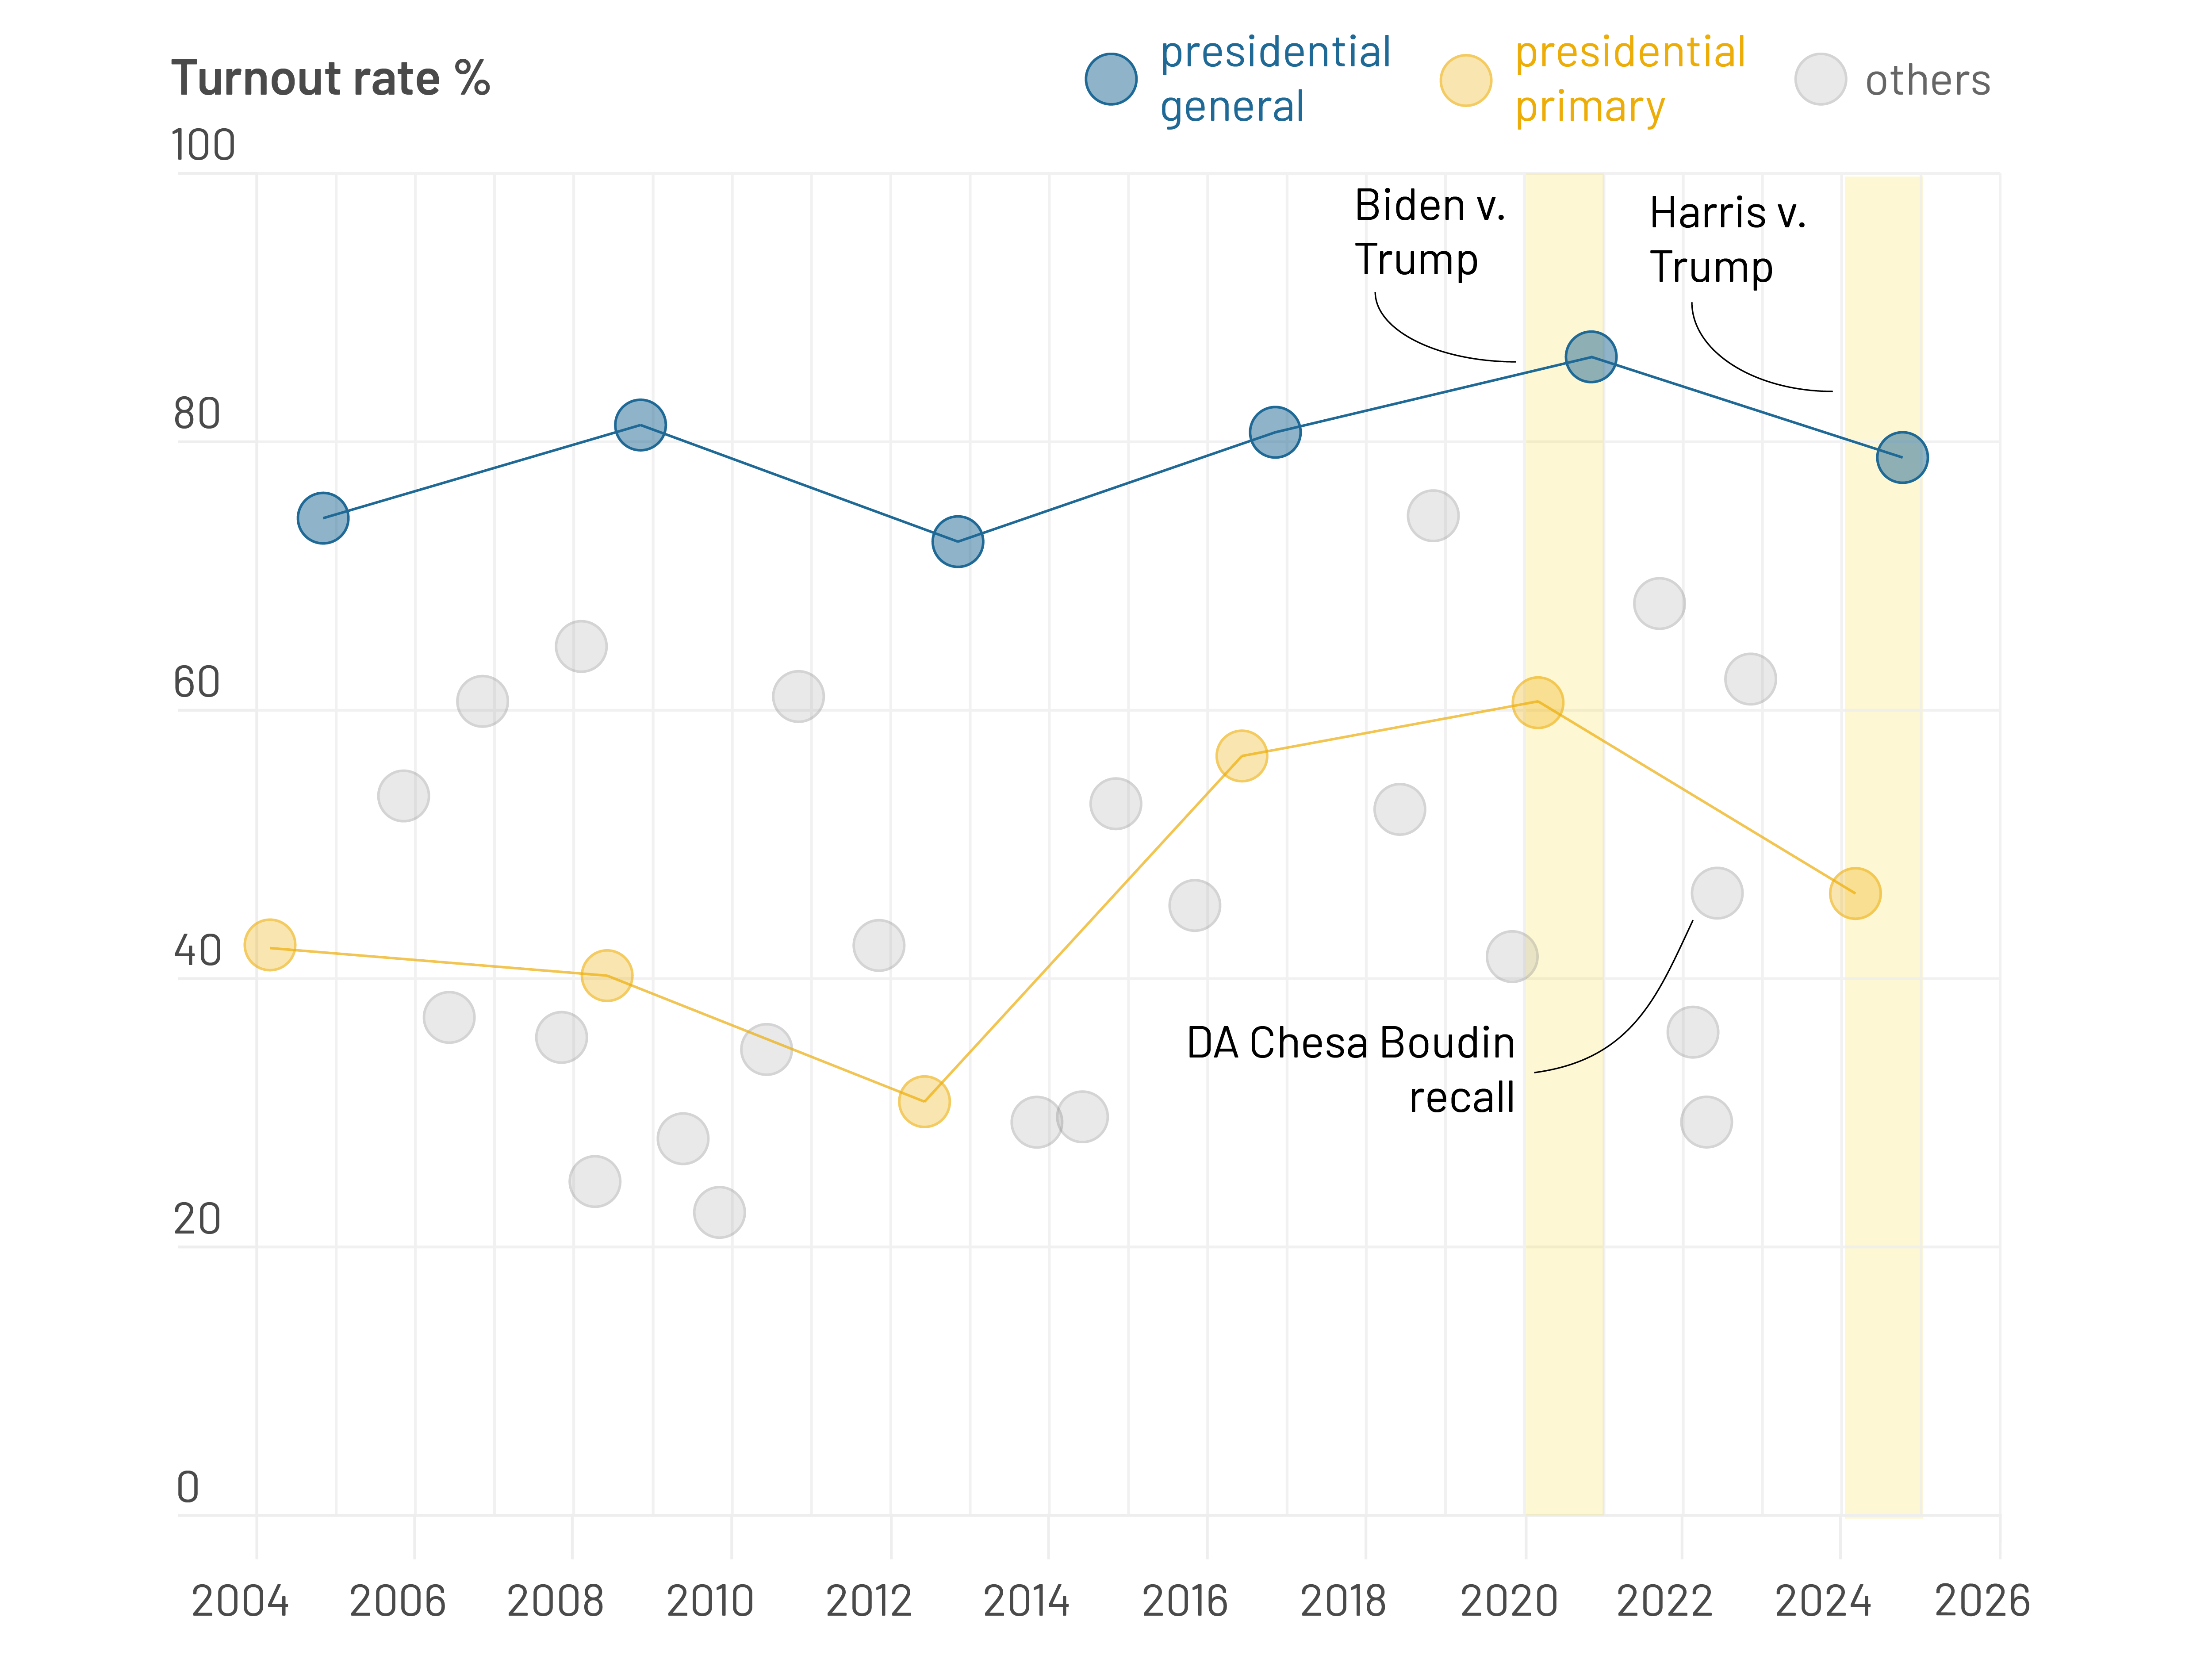
In 2020, turnout reached a near-record high of 86.3 percent in the presidential election. This November, turnout was a far cry from that: 78.9 percent.
San Francisco’s average turnout in presidential elections, going back to the 1916 election of Woodrow Wilson to a second term, is 77 percent. So this year was just slightly above average; there was no “Trump bump,” as in the last two general elections, but numbers were more in line with other years.
“There wasn’t that last extra spark that takes presidential turnout from good to great,” said Eric Jaye, a San Francisco campaign strategist. “Some [voters] are disillusioned with the choices that were offered. Enough of them stayed home, which was enough to slightly depress turnout.”
About 412,000 people voted in this year’s general election, 38,000 fewer than in 2020 — even though the total number of registered voters is about the same: 522,265 in this election compared to 521,099 in 2020. Fewer people voting in San Francisco is on par with state and national trends: Turnout in California was 17.2 percent lower than in 2020, according to the Associated Press.
Turnout in the S.F. November election was not high

presidential
general
presidential
primary
Turnout rate %
others
100
Biden v.
Trump
Harris v.
Trump
80
60
40
DA Chesa Boudin
recall
20
0
2004
2006
2008
2010
2012
2014
2016
2018
2020
2022
2024
2026

presidential
general
presidential
primary
Turnout rate %
others
100
Biden v. Trump
Harris v.
Trump
80
60
40
Chesa Boudin
recall
20
0
’04
’06
’08
’10
’12
’14
’16
’18
’20
’22
’24
‘26
Chart by Junyao Yang, updated by Kelly Waldron. Data from the San Francisco Department of Elections.
While turnout was not particularly high for a presidential election, more voters than ever before weighed on some of the local races, including the races for mayor, district attorney, city attorney, treasurer and sheriff. That’s thanks to 2022’s Proposition H, which shifted the election for some races from odd years, when few vote, to even years, when turnout is high.
That likely made more of a difference for the mayoral election, but less so for races like district attorney and city attorney, which were far less contested.
Jaye said that, in this election, campaigns typically spent less time turning people out to vote, and more time convincing them to vote for their candidate. That meant more budget spent on “media-centric persuasion” (ads) rather than field organization (knocking on doors, making phone calls).
Map by Kelly Waldron. Data from the San Francisco Department of Elections. Note: Precinct 9723 includes a turnout rate of above 100 percent, as reported by the Department of Elections.
2. Geographic divides
Geography played a big role in many of November’s races. Perhaps the starkest divide of all was the split on Proposition K, the measure to close the Great Highway to cars.
Map by Kelly Waldron. Data from the San Francisco Department of Elections.
Voters in districts closer to the Great Highway voted overwhelmingly against the measure; that’s Districts 1, 4, 7 and 11. But it was a citywide measure, and passed 55-45, a 35,600-vote difference.
“The impacts are incredibly geographic,” added Jim Stearns, Aaron Peskin’s political consultant, who also likened it to the Proposition E of 1998, which prevented the Central Freeway from being rebuilt, and kept Octavia Boulevard a ground-level road. Voters on the Westside strongly supported having the freeway at the time.

The outcome of Prop. K is likely a problem for District 4 Supervisor Joel Engardio, who oversees the Sunset and placed the measure on the ballot. “The voters in his district are overwhelmingly against this,” said Jaye. “That doesn’t go down well.”
Some geographic divides are also apparent in the supervisor race results, namely in Districts 7 and 9.
In District 7, incumbent Supervisor Myrna Melgar, who won, gained the most first-choice votes, 35 precincts overall.
Map by Kelly Waldron. Data from the San Francisco Department of Elections.
However, the 15 precincts that her opponent, Matt Boschetto, did win are all concentrated in the same area: Around West Portal, Forest Hills and St. Francis Wood. Those represent the most conservative neighborhoods in the district.
In those same precincts, more voters supported Proposition D, to cut commissions and empower the mayor and police chief, and Proposition F, to defer retirement for police officers, than voters citywide did (51 percent vs 43 percent citywide for Prop. D, and 49 percent vs 45 percent citywide for Prop. F). Fewer of those voters supported the bond propositions and Proposition L to tax ride-hailing vehicles (48 percent vs 57 percent citywide).
Likewise, in District 9, the precincts won by Supervisor-elect Jackie Fielder and those won by her primary opponent Trevor Chandler are split between more progressive and less progressive neighborhoods. Fielder won the precincts across the Mission District and Bernal Heights — all the precincts north of Alemany Boulevard. Chandler won those south, in the Portola, which represents a more conservative voter base (Chandler won 34 percent of first-round votes there, vs. 29 percent for Fielder).
Map by Kelly Waldron. Data from the San Francisco Department of Elections.
3. Money
At least $72 million was spent in the November election across all races. But money didn’t always prevail.
The most expensive campaign was Daniel Lurie’s winning $16 million run for mayor, funded in large part by himself ($8.7 million), but also by wealthy donors who gave to a PAC supporting him. While Lurie did benefit from a solid team of strategists and consultants, the resources that he had to build name recognition, pay staffers, attack his opponents and knock on doors certainly helped.
Big dollars propelled Lurie’s mayoral campaign
Streams show total flows of money going to candidate committees and PACs supporting the top candidates

Daniel Lurie
Mark Farrell
London Breed
Aaron Peskin
Ahsha Safaí
March
April
May
June
July
August
Sept.
Nov.
Oct.
Feb.
Jan.

Daniel Lurie
Mark Farrell
Aaron Peskin
London Breed
Ahsha Safaí
Jan.
March
May
July
Sept.
Nov.
Chart by Kelly Waldron. Data from the San Francisco Ethics Commission.
Lurie’s race wasn’t the only expensive ticket on the ballot, though. Proposition D, the TogetherSF measure to reform commissions and strengthen the mayor, also raised a massive sum: $9.5 million. But that fundraising did not secure a win: The measure was strongly rejected by a 13 percent margin (that’s 48,887 votes).
Remarkably, Proposition E, the competing measure, only raised some $69,000 (together with Proposition C), and still passed. That’s less than 1 percent of the funds raised by the Proposition D committee.
Prop. D raised over $9.5 million, while Prop. E raised $69,159

money raised for Prop. D
money raised for Prop. E

money raised for Prop. E
money raised for Prop. D
Chart by Kelly Waldron. Data from the San Francisco Ethics Commission.
In the supervisor races, which raised a total of $11 million, money did seem to boost some candidates in the most contentious contests.
Connie Chan, the incumbent who won in District 1, benefited from more than $1 million in third-party spending from labor groups, which was more than what her opponent Marjan Philhour received from PACs, about $346,000.
Likewise in District 11, Chyanne Chen, who won by 196 votes, was bolstered by some $600,000 in outside labor-backed spending. Michael Lai received some $282,000 in outside spending from groups like GrowSF and the Abundance Network.
4. Redistricting
We’ve already written how the 2022 redistricting, a long and controversial process, changed the electorates in District 5 and 7, likely damaging Dean Preston but boosting Myrna Melgar.
Redistricting had effects elsewhere, too.
In District 1, some of the city’s wealthiest precincts, those in Seacliff, were tacked onto the district before Connie Chan’s run for re-election. In Seacliff, the proportion of residents who earn over $200,000 is 26 percent above the city’s average.
The redistricting was a known issue for Chan: Seacliff neighborhoods were widely expected to go for Marjan Philhour and provide hundreds of additional votes. They did: In new precincts, 52 percent of first-choice votes went to Philhour.
But that wasn’t enough for Philhour to win. Philhour’s campaign was hindered by several factors: Philhour was outspent, ran against an incumbent, and also ran as a close ally to Mayor London Breed, who proved to be unpopular in District 1 this election; Breed only won a single precinct in the district.
In District 3, Danny Sauter also got a boost from redistricting: He gained a few new precincts in Russian Hill, and won 45 percent of first-choice votes in the neighborhood. Sauter did maintain a strong lead in the district overall, winning 39 percent of the first-choice votes.
“That was really a moderate base for Sauter in that district,” said Stearns, referring to the new precincts. “Neither Aaron Peskin, nor Moe Jamil nor Sharon Lai did well in those precincts.”
Correction: A previous version of this article incorrectly cited a lower number of registered voters.
Trump’s 2024 SF numbers (62,500 votes) are an increase of approx 10% (6,000) from 2020 (56,500). Not huge, but never bad to show an increase after a lower voter turnout.
The NY Times put out three SF maps yesterdays with different graphics indicating shifts by precincts from 2020 to 2024: Excelsior, Bayview, North Beach, and SOMA saw significant voter increase for Trump. The Tenderloin saw a steep Harris decline and a noticeable Trump increase. Western Addition, Mission, Bernal, Castro, and Chinatown saw fairly steep declines for Harris without proportionate rises for Trump overall. Sunset, Richmond, Pac Heights, and Marina shifted moderately towards Trump, about as one would expect. Noe Valley, Diamond Heights, and Dolores stayed relatively consistent.
https://www.nytimes.com/interactive/2024/11/28/us/elections/precinct-city-maps.html
Daniel Lurie “won.”
Kamala Harris “lost.”
Prop K “won.”
Marjan Philhour “lost.”
Bilal Mahmood “won.”
And now those candidates who “won” have to govern and legislate for the next 1460 days.
Odd that the “dump Dean” mobsters, a majority of whom do NOT actually live in D5, are on here crowing about “winners” and “losers.” Writing and putting Prop H on the ballot was proof of Preston’s courage and selflessness as an elected leader, a rare quality in a public servant. Dean Preston’s and Prop H ‘s aim: to get more people to vote for important offices and measures in local elections, thereby creating a more engaged electorate. As this excellent article states, post election data shows that 1) gerrymandering and 2) an RCV strategy with 4 moderate/conservative candidates versus one singular unapologetic democratic socialist plus 3) malaise for incumbents (locally and nationally) contributed mightily to this election’s outcomes. Policy making and legislating take time, patience and require vigilance and constant amending. For every “win” there are dozens of “losses.” The work is never finished.
Way back when, London Breed virulently opposed Prop H, the common sense legislation authored and brought to the ballot by Supervisor Dean Preston. Prop H put an end to off year mayoral elections, which generally created a very low bar for mayoral candidates. Supervisor Preston’s stated objective in bringing the matter to voters: getting more people to vote in local elections, aka higher voter turn out. From Joe Eskenazi’s 9/2022 column on the possible impacts of Prop H:
“Prop. H is the brainchild of Supervisor Dean Preston, a DSA member. The antipathy Breed feels for Preston — who gave her a competitive run for District 5 supervisor in 2016, and subsequently twice defeated Breed’s hand-picked successor, Vallie Brown — is probably enough to explain her abhorrence for Prop. H. If Preston came out in favor of water, Breed would likely advocate for everyone to cease drinking and bathing.
Both Breed and Preston lost so in the end H didn’t really work out. And especially since both lost to a more right-wing candidate, which was surely not Preston’s intent at all.
When a toxic psycho like Garry “die slow” Tan (who does not live in D5) and his lackey Techbro pals Steven Buss and Sachin Agarwahl (neither live in D5)form an Astroturf group like GROWSF (aka BROSF) and spend $300,000 to campaign against and “dump” a democratically elected district supervisor, district residents lose.
Does anyone have a link to a list of the total expenditures, both candidate donations and PACs supporting, of all of the SF Mayoral candidates? Did Lurie and the PACs that supported him spend more than the next four candidates combined?
https://sfethics.org/ethics/2023/12/campaign-finance-dashboards-november-5-2024.html
Woah. Stellar link. Thank you Tomo!
Please release the district-by-district maps for the supervisorial races in all the odd-numbered districts together. It would be useful to do a comprehensive look at the effects of the 2022 redistricting city-wide, now that we have results for the 2022 and 2024 races. Perhaps even with a comparison of the several maps which the redistricting committee were contemplating near the end of the process?
Ironic that Preston was instrumental in moving the mayoral race onto a presidential election cycle, thinking that a higher turnout would help progressives.
And the opposite happened, as he lost his seat and progressives lost overall control of the Board.
Oops.