
Good morning, Mission, and welcome to Virus Village, your (somewhat regular) Covid-19 data dump.
Recorded infections and overall positivity rates have flattened this week, though hospitalizations continue to dip. R Number estimates are very sketchy, but suggest the virus is on the rise again.
First things first. Readers responded with N95 sightings. N95 masks were seen at Ace Harware on Market Street, east of Church, and Center Hardware on Third Street had “a large supply.” N95s were also spotted at the San Francisco Costco, and at CVS and Safeway at 37th Avenue and Clement Street. CVS claims to have multiple locations in the City selling masks; go to their website for details. Other online recommendations are United States Mask and Project N95
An N95 mask shortage is looming again. Why? Because hospitals are not stocking up or buying low cost Chinese models. Thanks, guys. We sacrifice to keep hospitals from getting overwhelmed, but hospitals refuse to change their staffing and resource practices.
It appears cloth mask mandates did little to stop the spread of the virus. Kudos to former mask evangelists who have changed their recommendations.
Is the lull in the omicron drop a sign that BA.2 will be taking off soon? Possibly. What can we expect in a potential BA.2 surge? Some national covid celebrities are taking a modified “what me, worry?” position. Others are not so sanguine. Here’s the latest from the UK and from western Europe. Although The Vaccine continues to mitigate severe disease, don’t count on vaccination or previous infection to protect against getting infected again.
Here is the latest on workplace outbreaks in California. There have been 7,943 outbreaks associated with 105,083 recorded infections since Jan. 1, 2022. Perhaps due to omicron, these are some of the highest numbers seen since reports began. By far (26 percent of the total), the greatest number are in elementary and secondary schools. Note, even though by law local public health departments should have this data, the San Francisco Department of Public Health continues its refusal to report what it knows on workplace outbreaks.
As expected, there is a lot of talk about the fourth shot. Here, here and here is the data so far. Let’s see if the data makes a difference this time around.
For years, the U.S. Centers for Disease Control and Prevention has been criticized for operating with a lack of data and data analysis. When the pandemic struck there was no national database, and there still isn’t. Now, after two years of bumbling and fumbling, the CDC may be getting the message. How about the San Francisco Department of Public Health?
After apparent hibernation for much of the winter, a new mobile testing program may be a sign SFDPH is waking up.
Community clinics have taken on the burden of vaccinating low-income residents and those without insurance. Contrary to an agreement, the state is not reimbursing them. Apparently, the clinics need to up their game and donate more to Newsom’s campaign, like Blue Shield and Kaiser, if they expect to receive what they’re owed.
Finally, in case you didn’t see it earlier, reports show the repeated setbacks to developing an HIV vaccine laid the groundwork for covid vaccines. There are now new HIV vaccine possibilities in clinical trials.
Scroll down for today’s covid numbers.
It seems the local vaccination program has hit the wall. As of March 22, DPH reports 410 new vaccinations since last week. Still, the Department reports more than 89 percent of all San Francisco residents have received one dose, and over 83 percent have received two. For residents 5 and older, those with one dose remain above 90 percent and those with two rose again to 87 percent while for those 65 and older over 90 percent have received two doses. The number of boosters is virtually unchanged from last week. As of March 22, approximately 472,025 SF residents (65 percent of all residents, 83 percent of residents 65 and older) have received a COVID-19 booster dose, an increase of less than .5 percent over the past week.
For information on where to get vaccinated in and around the Mission, visit our Vaccination Page.
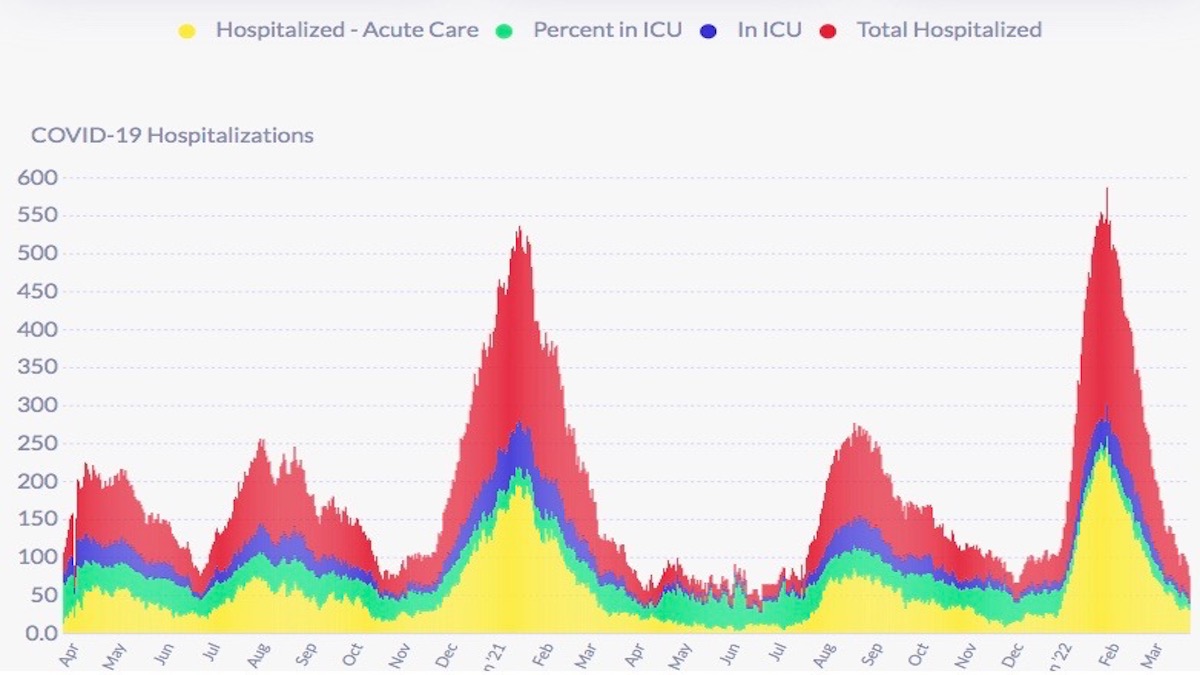
Over the past week, hospitalizations have dropped 23 percent. On March 19, DPH reports there were 33 covid hospitalizations, or about 3.7 covid hospitalizations per 100,000 residents (based on an 874,000 population). ICU patients dropped below 5 for the first time since June 16. Today, the California Department of Public Health reports 39 covid patients in SF hospitals and 7 ICU patients.
The latest report from the federal Department of Health and Human Services shows Zuckerberg San Francisco General Hospital with 4 covid patients and 7 ICU beds available, while across the Mission, CPMC had 1 covid patient and 3 ICU beds available. Of 46 reported covid patients, 23 were at either SFGH or UCSF, with at least 73 ICU beds available among reporting hospitals (which does not include the Veterans Administration). The California DPH currently reports 101 ICU beds available in San Francisco.
Between Jan. 17 and March 18, DPH recorded 1,451 new infections among Mission residents or 247 new infections per 10,000 residents. Bayview Hunters Point continues with the highest rate at 400 new infections per 10,000 residents. Of 38 neighborhoods, most had rates over 200, and 5 had rates above 300 per 10,000 residents, all in the east and southeast sectors of the City. Noe Valley had the lowest rate at 149 per 10,000 residents.
DPH reports on March 15, the 7-day average of daily new infections recorded in the City was 80 or approximately 9.2 new infections per day per 100,000 residents (based on an 874,000 population), representing a 4 percent drop from last week. However, during most of the past week, numbers were in the mid-70s. According to DPH, the 7-day average infection rate among vaccinated residents was 8.4 per 100,000 “fully vaccinated” residents and 16.4 per 100,000 unvaccinated residents. It is unclear whether “fully vaccinated” means 2 or 3 doses. Of interest, the New York Times reported the 7-day average number on March 15 was 34. Today it reports the average number on March 22 was 60, a 23 percent drop “over the past two weeks.” For those interested in wastewater monitoring, see here.
As of March 18, DPH has recorded 476 infections among White San Franciscans so far in March, or 31 percent of the total; Asians 424 infections, or 27 percent, Latinxs 151 infections or close to 10 percent, Blacks 46 infections or 3 percent, Multi-racials 25 infections or 1.6 percent, Pacific Islanders 5 infections or .5 percent and DPH recorded 3 infections among Native Americans so far in March, or .2 percent of the recorded infections so far this month.
As of March 18, DPH reports so far this month a 3.2 percent positivity rate among Pacific Islanders; Asians 2.7 percent, Whites 2.6 percent, Native Americans 2.5 percent, Multi-racials 2.3 percent, Latinxs 2.1 percent, and Blacks have a 1.7 percent positivity rate so far in March.
Seven new covid-related deaths have been reported, bringing the total since the beginning of the year to 148. DPH won’t say how many were vaccinated and how many unvaccinated. Nor does it provide information on the race/ethnicity or socio-economic status of those who have recently died. The omicron death toll seems higher than delta. During and after the delta surge, July-October, the number was 105. According to DPH “COVID-19 deaths are suspected to be associated with COVID-19. This means COVID-19 is listed as a cause of death or significant condition on the death certificate.” Using a phrase like “suspected to be associated with” indicates the difficulty in determining a covid death. The ambiguity is heightened when currently DPH continues to report only 21 of the 842 deaths are known to have had no underlying conditions, or comorbidities. Note: As we’ve known for some time, there is no uniform standard for recording what is or is not a covid death.
Covid R Estimation has not been reported since March 4, when it estimated the San Francisco R Number at .45. On March 21, it estimated the California R Number estimate at .69. I suspect the problem with the SF number may have to do with the site’s reliance on case numbers from the New York Times, which have been somewhat squirrely this month. The ensemble, as of March 21, estimates the San Francisco R Number at 1.05 while estimating the California R Number at .83. Only two models were included in the SF average, one at .94, one at 1.21. Although very unclear and fragmentary, it does appear the virus is circulating around town more now than it has been for at least a month.
As of March 18, DPH has recorded 48 new infections among San Franciscans aged 0-4 so far in March or 3.1 percent of the month’s total; 5-11 68 infections or 4.4 percent, 12-17 46 infections or 3 percent, 18-20 32 infections or 2.1 percent, 21-24 129 infections or 8.3 percent, 25-29 249 infections or 16 percent, 30-39 416 infections or 26.8 percent, 40-49 224 infections or 14.4 percent, 50-59 135 infections or 8.7 percent, 60-69 113 infections or 7.3 percent, 70-79 50 infections or 3.2 percent, and DPH recorded 44 infections, or 2.8 percent of the March total so far among San Franciscans aged 80 and above.
> Myoung Cha: 23/ If this BA.2 wave is much worse than people expect, it will put the government in a tough spot to re-introduce restrictions without any of the funding to respond in a timely fashion. We could be in rough shape by May/June without much recourse.
Regarding masking, it is dismal how little nuance is in the discussion
It’s either “we must have mask mandates until” or “masks are over”
I think the perpetual mask mandaters are making a mistake and alienating people by not acknowledging that masking is highly dependent on local conditions.
Right now in San Francisco, a volunteer masking regime seems quite quite reasonable. Let people take a break, have a breather, enjoy Spring while reminding us that mask mandates might be needed later.
When I go to stores and the like, almost everyone is masked anyway.
What are the pros and cons of mandating masks at this moment and not letting people make a choice at this moment.
Especially as we have recent reports of the high cost to mental illness the pandemic has brought on, probably due to isolation.
But sure, let’s just annoy people.
thanks for the wastewater link, that seems to be one of the best forward monitors (although their website has just the worst UI to figure out since the data and the map are not in the default tab and are also on different tabs)
the nytimes data has been frustrating me the past few weeks, they keep reporting “data anomaly” days without any exploration of what the anomaly is, where in the pipeline it is occurring (ie, with the raw data) , or why it is occurring (some announced change in the data to correct for something?). Many days have in fact been reported as having negative new case numbers