
Good morning, Mission, and welcome to Virus Village, your (somewhat regular) Covid-19 data dump.
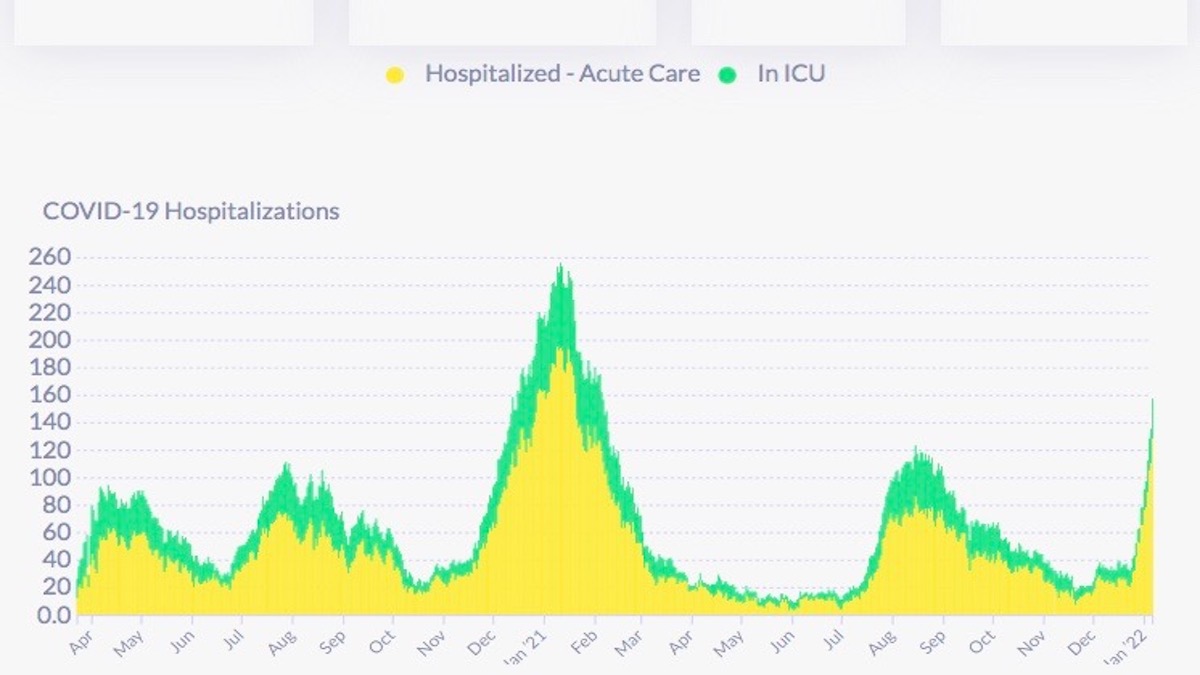
Klay’s back, and the Niners’ improbable win puts them in the playoffs. Omicron couldn’t care less, as infections continue to soar and hospitalizations (though not ICU patients) rapidly increase.
Unlike Canada, which limited arena capacity when the Dubs played Toronto a couple of weeks ago, there are no restrictions on indoor crowds here, and although indoor masking requirements remain in effect, maybe a third to half of the fans at Chase are wearing them. There’s no enforcement.
If you are limiting yourself to one omicron story per day (wise), then read Joe’s piece on the San Francisco Unified School District and testing in SF schools. What role did the San Francisco Department of Public Health play in not providing tests?
Last week, in Annie’s story about the lack of N95 masks among restaurant workers, Dr. Susan Phillip made it clear that the City will do nothing to help, other than providing minimal, and in most cases unactionable, information (like high-quality masks are “easily obtainable”). Why can Milwaukee hand out a half-million N95s, but our poor little rich city can’t?
Fake testing sites? What do you expect when SFDPH puts out information like this: “On Monday, some SFDPH-affiliated sites will temporarily reduce testing hours due to challenges beyond our control.” Challenges? Like people needing to get tested?
And some think I’m cynical.
More and more, we are reading about endemicity, which means basically learning to live with covid (again, a whiff of cynicism). In the UK, the head of the vaccination program has called for an end to mass vaccination. If you read down in the article, there is a long quote by one of the leaders of the National Health System who says covid has exposed the “weakest link” the UK health system: lack of adequate staff.
As noted last week, it’s same phenomenon in the U.S. See reports by The Atlantic’s Ed Yong and an ER doc in NYC. BTW, why do we know more about the condition of hospitals in New York than in San Francisco?
The lack of staff has led the California Department of Public Health to eliminate isolation/quarantine for hospital workers who test positive but are asymptomatic. Should we now conclude transmission from asymptomatic people (one of the primary reasons given for distancing and masking in 2020) is no longer a problem?
Why are rapid tests in such short supply? Yes, the FDA bottled things up, but it’s more basic, i.e. supply and demand, or another consequence of healthcare for profit, not health.
Those who take part in trials for vaccines and drugs often feel they are doing so to aid humanity. One participant who took part in a Moderna trial now feels he’s been betrayed. (Note: as a professor of “international relations and religion,” he should have known.)
Scroll down for today’s covid numbers.
The U.S. Centers for Disease Control data used for the chart lags behind the data supplied from the San Francisco Department of Public Health. As of Jan. 9, DPH reports more than 88 percent of all San Francisco residents have received one dose, and over 81 percent have received two. For residents 5 and older, DPH reports the figures rise above 90 percent and above 85 percent and over 90 percent of those 65 and older have received two doses. SFDPH reports that as of Jan. 9, approximately 410,615 residents (58 percent of all residents) have received a COVID-19 booster dose including 78 percent of residents 65 and over, 67 percent for those 50-64, 62 percent for those 35-49 and 48 percent for those 16-34. For information on where to get vaccinated in and around the Mission, visit our Vaccination Page.
Despite fewer than last winter, hospitalizations are rising quickly. On Jan. 6, DPH reports covid hospitalizations jumped to 157, or about 18 hospitalizations per 100,000 residents (based on an 874,000 population), including 29 now in ICU. The California Department of Public Health currently reports 178 covid patients in SF hospitals with 30 in ICU. Note: SFDPH refuses to provide (or is incapable of providing) demographic information about covid patients, how many are in the hospital for covid, or the number of vaxxed and unvaxxed covid patients. The reason they give for the latter, is that even though they produce daily hospitalization numbers, they can’t tell which are hospitalizaitons are for covid, and which are hospitalizaitons with covid. Maybe they should ask UCSF, which treats most covid patients in the city . According to UCSF’s latest data, about 1/3 of adult hospitalizations are with covid.
The latest report from the federal Department of Health and Human Services shows Zuckerberg San Francisco General Hospital with 11 covid patients and 10 ICU beds available, while across the Mission, CPMC had 3 covid patients and 6 ICU beds available. Of 52 reported covid patients, 37 were at either SFGH or UCSF, with at least 91 ICU beds available among reporting hospitals (which does not include the Veterans Administration). The California DPH currently reports 87 ICU beds available in San Francisco.
Note: DPH uses dated population figures for neighborhoods. Between Nov. 6 and Jan. 5, DPH recorded 1438 infections among Mission residents or 245 infections per 10,000 residents. The high number (highest in the City) may be in part due to continuous testing at 24th Street (thanks to LTF and UCSF). Sunset/Parkside and Bayview Hunters Point also report over 1000 infections. Mission Bay now has the highest rate, with 324 infections per 10,000 residents. Of 38 neighborhoods, 25 have rates over 200 per 10,000 residents. Lakeshore, the only SF neighborhood with less than 50 percent of its residents vaccinated has the second lowest rate, 134 per 10,000 residents.
On Jan. 2, the 7-day average of daily new infections recorded in the City was 1245 or approximately 142.3 new infections per day per 100,000 residents (based on an 874,000 population). The 7-day average infection rate among vaccinated residents was 219.4 per 100,000 vaccinated residents and for unvaccinated residents, 135 per 100,000 unvaccinated residents. Note: Don’t get too excited about the indicated dropoff in recent days. Those numbers are “less reliable”.
DPH has revised its December numbers. It now reports 5,685 infections among White SF residents, 37.8 percent of the total, Latinxs, 2,907 infections, 19.3 percent, Asians 3,428 infections, 22,8 percent, Blacks 851 infections, 5.7 percent, Multi-racials 243 infections, 1.6 percent, Pacific Islanders 175 infections, 1.2 percent, and Native Americans had 51 infections, .3 percent of December totals.
In December, 12.1 percent of SF Latinx residents tested positive for covid; Pacific Islanders 11.2 percent, Native Americans 10.4 percent, Multi-racials 9.4 percent, Blacks 9.3 percent, Whites 8.5 percent, and 6.8 percent of SF Asian residents tested positive for covid in December.
One more December covid-related death and 1 new January death have been recorded.
Covid R Estimation has kept its San Francisco R Number at 1.96 and slightly lowered its California R Number to 1.71. The ensemble raised its average for the San Francisco R Number to a doubtful 1.31 (heavily influenced by one model which, consistently very low, now estimates .51) while posting an average California R Number of 1.57.
One reason why hospitalization numbers may have “decoupled” from infection numbers is that we don’t see the outbreaks in nursing homes we saw in 2020. In December, DPH has recorded only 9 infections and 2 covid-related deaths in 19 “skilled nursing facilities”. Single Room Occupancy hotels (SROs) recorded 182 infections and 0 covid-related deaths in December. One more death was added in January. Among those unhoused, 121 December infections and a pandemic total of 7 covid-related deaths have been reported.
I’ve worked in some data roles where things seem simple but are actually really messy. Just a hunch that data problems described above could be easily explained by the following:
Data Variable A = Date of sample collection
*This doesn’t mean that on the day the sample is collected, this variable is reported into whatever data system.
Data Variable B = Date of test result
*Again, there’s a difference between what happened and when humans put it into data systems and transmitted it to other data systems.
Now, in the entire world of samples collected and tests resulted across the county, there will be lags. How long between the actual time of A and the time it is reported into a system the city uses? There will always be retroactive corrections to the posted data so you should expect to see numbers change, even for the data that is “more reliable.”
Then there’s the lag between sample collection and test resulting. It could be same-day or more than a week if the labs are overwhelmed or something else goes wrong. Same problem, the data probably takes a while to settle down.
I just noticed too a link to some details about the messy stuff and how they deal with it. ANd a link to “source data” so it seems like if you’re suspicious you can at least check methods.
https://sf.gov/information/covid-19-data-questions
I’m getting more & more cynical about SFDPH, too. Thanks, Mark, for your steady tracking.
Mark I checked the city numbers and it looks like you reversed the case counts per 100,000 vaccinated and unvaccinated. 219 is unvaccinated and 135 is vaccinated.
Well spotted
So, as someone who neurotically watches the numbers, it’s finally hit me that there’s an odd disconnect on the city’s case vs testing data.
The most recent day for “more reliable” data is January 2. They say there were 942 new cases on that day. But if you look at testing statistics, there were 7,249 tests conducted that day with a positivity rate of 17.3%.
17.3% of 7,249 is 1,254, not 942. How does that make sense?
The Chronicle recently ran an article explaining that SF DPH reports cases as occurring on the date of sample collection (vs the state that tries to guess actual infection dates). So presumably it should match the tests conducted and the percent that returned positive.
That disparity in cases per day reported and (pos test%) x (tests/day) becomes even larger if you look at 1/3 or 1/4. Suggests over 3k cases a day yet the case numbers reported are much lower. The notes on the SFGOV site state that all data reflect sample collection dates. In any case, the true numbers are likely a multiple of what’s reported out, though you would expect transparent reporting from the city.
Good point, which leads me to wonder if the SFDPH is actually just recording and reporting whatever, rather than working under state authority or based in any kind of science.
Wait, are they friends with the folks at SFUSD?