Good morning, Mission, and welcome to Virus Village, your (somewhat regular) Covid-19 data dump.
The average number of recorded daily infections in San Francisco remains static from Monday, as hospitalizations have fallen below 30. R Number models continue to show San Francisco above 1 and the positivity rate is getting close to 2.
Despite low hospitalization numbers, get ready for more stories on overflowing hospitals. That may happen, but let’s not rush to blame the virus.
One of the reasons hospitals get overrun is the lack of staff. Health care workers are leaving hospitals in droves. And who can blame them? Low pay, long hours and lack of protective equipment will do that.
Low staffing in hospitals is only part of the problem. The labs where tests are taken and analyzed exist are also running out of people, and the temporary boost in federal funding looks to be too little too late.
In a King Kong v. Godzilla remix, hospitals and Big Pharma are fighting over drug discounts. Guess who’s the big loser.
Austria has decided to lockdown the unvaxxed. Good luck with that.
Despite promises to redistribute The Vaccine to poor countries, the UK is throwing it away. It’s an “absolute scandal” says the government that dumped the doses.
Despite nearly universal flogging of the booster, there’s precious little data. Here’s some more from a recent study in the UK. The study looks at symptomatic infection and transmission, not the severity of disease and hospitalization.
Though the company still continues to hog its vaccine, Pfizer has said it will allow its new pill to be produced and distributed cheaply. But not everywhere.
Scroll down for today’s covid numbers.
The U.S. Centers for Disease Control data used for the chart lags behind the data supplied from the San Francisco Department of Public Health. As of Nov. 16, DPH reports more than 83 percent of all San Francisco residents have received one dose, and 76 percent have received two. For residents 5 and older, DPH reports the figures rise substantially to 87 percent and 80 percent. On Nov. 16, the seven-day rolling average of newly vaccinated (one dose) residents was 1,402. There is no new data to report on boosters. Of 118,000 SF seniors eligible for boosters, as of Nov. 1, only 23,000 had received it. Another 52,000 boosters were given to those under 65 who are at greater risk of hospitalization. In case you missed it, everyone who wants a booster can get it. For information on where to get vaccinated in and around the Mission, visit our Vaccination Page.
On Nov. 13, DPH reports there were 27 covid hospitalizations, or about 3.1 per 100,000 (based on an 874,000 population). It’s the lowest number since July 14. There are no new updates on hospitalizations among fully vaxxed residents. According to the latest from DPH, in the month of September the hospitalization rate for unvaxxed residents was 64.8 per 1000 cases while for vaxxed residents it was 20 per 1000 cases. The picture when age is factored in provides a more nuanced view. Fully vaxxed seniors (over 60) have higher rates of hospitalization than younger unvaxxed residents. DPH says its data comes from hospitalizations caused by covid, not another medical condition. According to the CDC, for the week ending Nov. 12, there were 15 new admissions to SF hospitals (-21.05 percent from the previous seven days). During that week, covid patients accounted for 1.6 percent of SF hospital beds (no change from the prior week) and 4.68 percent of the ICU capacity (no change).
The latest report from the federal Department of Health and Human Services shows Zuckerberg San Francisco General Hospital with 6 covid patients and 6 ICU beds available, while across the Mission, CPMC had 3 covid patients and 3 ICU beds available. Of 37 reported covid patients, 24 were at either SFGH or UCSF, with at least 69 ICU beds available among reporting hospitals (which does not include the Veterans Administration). The California DPH currently reports 73 ICU beds available in San Francisco. SFDPH won’t say.
Note: DPH uses dated population figures for neighborhoods. Between Sept. 13 and Nov. 12, DPH recorded 283 cases in the Mission or a rate of 48 per 10,000 residents. During that period, although Bayview Hunters Point had the most cases (252), Chinatown had the highest rate, 78 per 10,000 residents. Mission Bay, SOMA, Tenderloin and the Marina also had rates of at least 60 per 10,000 residents.
On Nov. 9, the 7-day average of daily new cases in the City was 79, or approximately 9.0 new cases per day per 100,000 residents (based on an 874,000 population). The 7-day average case rate among vaccinated residents was 8.5 per 100,000 fully vaccinated residents and for unvaccinated residents 12.6 per unvaccinated 100,000 residents.
DPH will not release November data until Nov. 20. As of Oct. 31, White San Franciscans recorded 707 cases or 40.4 percent of all October cases, Latinxs 310 or 17.7 percent, Asians 369 or 21.1 percent, Blacks 106 or 6.1 percent, Multi-racials 46 or 2.6 percent, Pacific Islanders 16 or .9 percent and Native Americans recorded 4 cases in October or .2 percent of the month’s total.
The Citywide average posititivity rate continues a slow climb. For the month of October, Native Americans recorded a positivity rate of 3.7 percent, Pacific Islanders 2.4 percent, Latinxs 1.8 percent, Multi-racials 1.6 percent, Whites 1.6 percent, Blacks 1.3 percent and Asians 1.2 percent.
DPH has reported San Francisco’s first November covid-related death, bringing the Delta total (August through November) to 91 and the cumulative covid-related death toll to 668. Last spring’s surge resulted in approximately 90 covid-related deaths recorded between August and October. As of Sept. 30, DPH reports 16 covid-related deaths among “fully vaccinated” residents. Of those San Franciscans who died covid-related deaths, 3 percent had no underlying conditons.
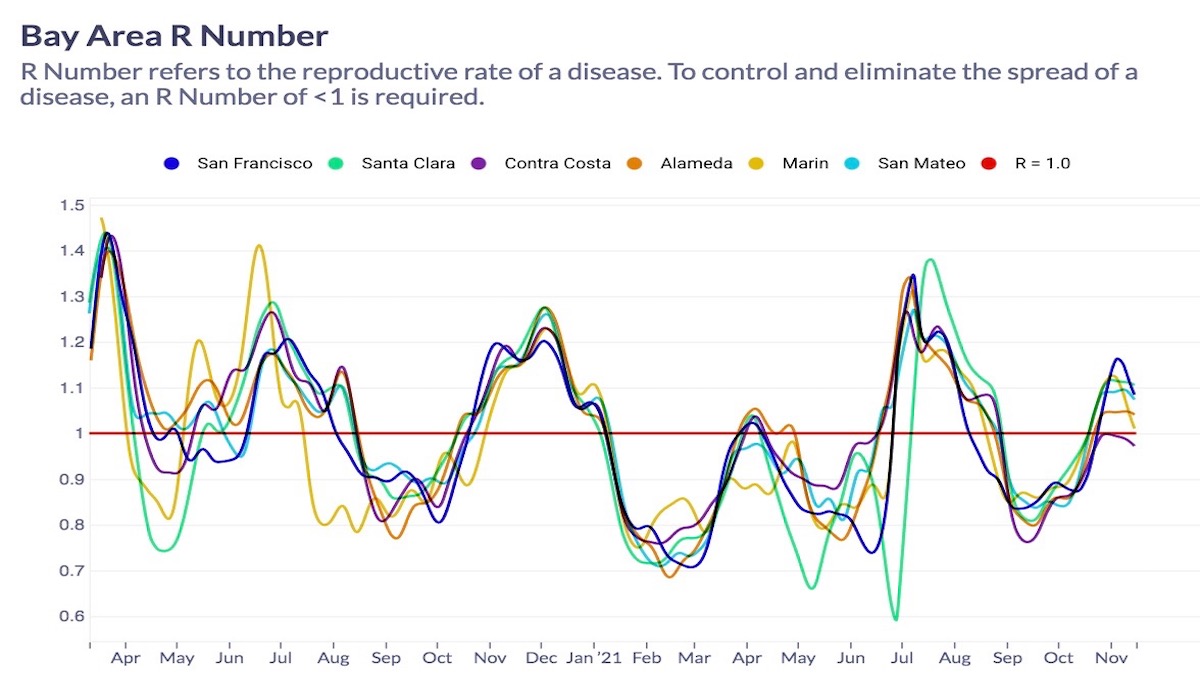
R Number estimates from Covid R Estimation have been fluctuating a great deal recently. Over the past week, this model has estimated the San Francisco R Number in a range from .94-1.29, for a current reading of 1.08. It’s the second highest rate in the state. For the California R Number, the estimate is .97. The ensemble lowered its average for the San Francisco R Number to 1.01. All but two models in the ensemble currently show the City over 1. The average California’s R Number has been lowered to .83 with all models showing the state below 1.
In October, DPH recorded 981 new cases among males, down from 1,512 in September, and 754 cases among females, down from 1,342 in September. Only 1 new trans male case was recorded in October and 0 for trans females. In addition, 32 new October cases were recorded for those unhoused, down from 46 in September.