
Good morning, Mission, and welcome to Virus Village, your (somewhat regular) Covid-19 data dump.
Not as quickly as we would like, but the numbers continue their downward slide Hospitalizations remain relatvely high, but positivity rates remain below 3 percent and most models show the R number below 1.
DPH has a reporting problem. “Due to a network outage, the data on this page will not update for the next few days, starting on 9/3/2021.” The numbers below are the latest posted.
A new study out of the University of Illinois shows vaccinated individuals with a “breakthrough” infection are LESS likely to shed infectious virus at a given viral load, shed for a SHORTER period of time compared to unvaccinated individuals, AND report fewer days of symptoms.
And here’s another look at the Israeli data (a country often cited for why a booster is needed). It appears at least some independent advisors with the U.S. Centers for Disease Control are pushing back against giving boosters to the general population.
Attention sports fiends. Is it safe to go to a game? Is it safe to tailgate? Medical experts weigh in on what you might consider by now to be covid common sense.
Scroll down for today’s covid numbers.
The CDC data used for the chart lags behind the data supplied from the San Francisco Department of Public Health. As of Sept. 4, DPH reports about 79 percent of all San Francisco residents have received one dose, and more than 73 percent are completely vaccinated. On Sept. 4, the seven-day rolling average of shots per day was 432. For information on where to get vaccinated in and around the Mission, visit our Vaccination Page.
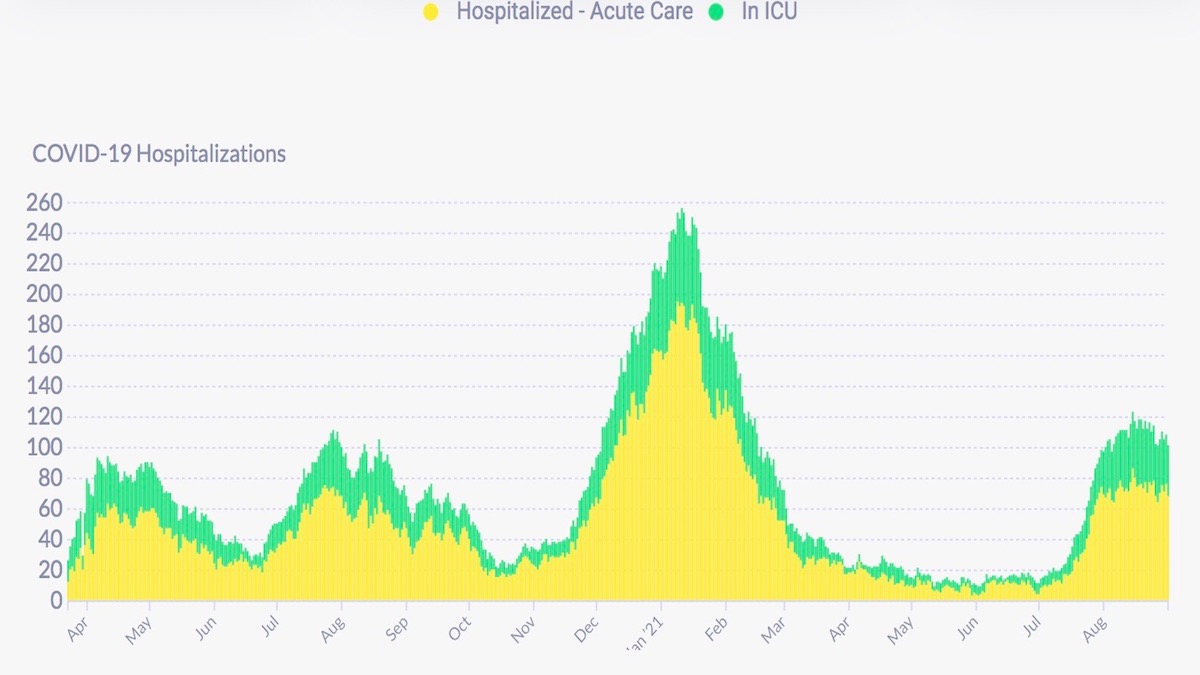
Hospitalizations continue pretty much plateaued at a relatively high level. On Sept. 1, DPH reports there were 101 hospitalizations, 68 in acute care, 33 in the ICU. The latest update from DPH says 73 fully vaccinated San Franciscans have been hospitalized (a rate of 14.5 per 1,000 cases compared to 76.6 per 1,000 cases for those not fully vaccinated) . According to the CDC, for the week ending Sept 2, covid patients accounted for 5.53 percent of hospital beds (-.059 from previous week) and 12.64 percent of ICU beds (-1.6 from previous week ). As of Aug. 30, the CDC says that of 173 million vaccinated U.S. residents, 12,908 patients with a COVID-19 vaccine breakthrough infection were hospitalized or died. Of that number 25 percent either had no covid symptoms or their hospitalization or death was not COVID-related
The latest report from the federal Department of Health and Human Services shows SFGH with 20 covid patients and 76 percent ICU occupancy, while across the Mission, CPMC had 20 covid patients and 89 percent ICU occupancy. Of 118 reported covid patients, 55 were at either SFGH or UCSF.
New cases in the Mission are apparently tapering off. Between July 2 and Aug. 31, DPH reported 783 new cases among Mission residents (or 133 new cases per 10,000 residents) and 914 new cases in Bayview Hunters Point (241 new cases per 10,000 residents). During this period, four other neighborhoods had more than 400 new cases: Sunset Parkside, Excelsior, SOMA and the Castro, which still has the second highest neighborhood rate at 186 per 10,000 residents.
Case rates lack precision but give a general picture of the virus’ prevalence and trajectory. DPH reports for the week ending Aug. 28, the seven-day rolling average of daily new cases in the city was 132 new cases (down fron 145 reported for that date last week), or approximately 14.7 new cases per day per 100,000 residents (based on an 896,000 population). DPH reports today that of Aug.31, the 7-day average case rate among fully vaccinated residents was 8 per 100,000 and for unvaccinated the rate was 29.5 per 100,000.
For the month of August, White San Franciscans had 2,003 positive tests, Latinxs 1,212, Asians 944, Blacks 701, Multi-racials 102, Pacific Islanders 95 and Native Americans had 20 positive tests. All groups had higher numbers in August than july, with Whites having the biggest jump.
For the month of August, the Mission had a positivity rate of 4.4 percent, Bayview Hunters Point had the highest rate in the City at 6.2 percent, and the Presidio had the lowest rate at 1.8 percent. Of interest, weakly vaccinated Lakeshore now has a 5.2 percent positivity.
Covid-related deaths in San Francisco are always difficult to ascertain. Now DPH reports 19 August deaths, bringing the covid-related death toll to 592. DPH provides no demographic data for monthly deaths, but reports that, as of Aug. 30, six of all covid-related deaths were among those fully vaccinated.
Covid R Estimation lowered its estimate for the San Francisco R Number below 1 to .94 and its estimate for the California R number to 1.02. Most models in the ensemble continue to estimate the San Francisco R Number below 1, with an average of .80, while the average California R Number is .90.
For the month of August, San Franciso residents 0-4 had 179 infections, 5-10 294, 11-13 134, 14-17 137, 18-20 153, 21-24 487, 25-29 899, 30-39 1,412, 40-49 797, 50-59 621, 60-69 368, 70-79 194, 80+ 197. The 50-59 group jumped 235 infections. The only group with less infections this month than last was the 20-25 group. The highest group, 30-39, had about the same number,
The SFDPH finally started reporting cases rates for vaccinated vs unvaccinated. You should add it to your daily updates.
“New cases by vaccination status”
https://sf.gov/data/covid-19-cases-and-deaths#new-cases-by-vaccination-status