
Good morning, Mission, and welcome to Virus Village, your (somewhat regular) Covid-19 data dump.
Buckle up, San Francisco. Delta’s bumpy ride seems far from finished.
When Delta debuted, local infection numbers quickly soared above last summer’s surge. After more than a month, they began to drop, precipitously at first, then slowly. Now, in the last few days, they are rising again.
Hospitalization numbers rose too, though at a slower pace. They eventually surpassed last summer before falling. But, unlike last summer (and winter), the way down has been fitful and halting.
The national picture is equally muddled, which makes the case for rapid tests much more obvious, especially in schools. As a reader pointed out, FDA delays in authorization pose a major obstacle.
The efficacy of the mRna vaccine endures through Delta according to latest studies. The J&J shot has also been showing substantial real-world efficacy.
Vaccines are efficacious; so are community-based, people-to-people programs to reach the hesitant, the misinformed and those without access to vaccine providers.
The rich countries of the world deserve the F in ethics for hoarding The Vaccine. Not only a moral issue, or a scientific issue, rampaging covid among low-wage workers undermines the global economy, causing widespread supply problems that are inceasingly difficult to manage.
Whereas we can’t foresee what the virus may or may not do in the coming months, it’s a good bet we’ll see more vaccine mandates as well as efforts to combat counterfeit vaccine cards.
Scroll down for today’s covid numbers.
The U.S. Centers for Disease Control data used for the chart lags behind the data supplied from the San Francisco Department of Public Health. Here, the vaccination picture remains relatively static . As of Sept. 21, DPH still reports more than 79 percent of all San Francisco residents have received one dose, and more than 73 percent are completely vaccinated. On Sept. 21, the seven-day rolling average of shots per day dropped again to 241. For information on where to get vaccinated in and around the Mission, visit our Vaccination Page.
On Sept. 18, DPH reports there were 68 hospitalizations, or about 7.8 per 100,000 (based on an 874,000 population). The latest update from DPH says 77 fully vaccinated San Franciscans have been hospitalized (a rate of 12.6 per 1,000 cases compared to 85.1 per 1,000 cases for those not fully vaccinated) . According to the CDC, there were 47 new admissions for the week ending Sept. 19 (-11.32 percent from the previous week). For the week ending Sept. 19, covid patients accounted for 3.77 percent of hospital beds (-.64 percent from previous week) and 7.72 percent of ICU beds (-.70 percent from previous week). As of Sept. 13, the CDC says that, of more than 178 million vaccinated U.S. residents, 15,790 patients with a covid vaccine breakthrough infection were hospitalized or died (though not all of those died or were hospitalized due to covid, or displayed covid symptoms).
The latest report from the federal Department of Health and Human Services shows Zuckerberg San Francisco General Hospital with 15 covid patients and 74 percent ICU occupancy, while across the Mission, CPMC had 7 covid patients and 61 percent ICU occupancy. Of 82 reported covid patients, 47 were at either SFGH or UCSF.
Between July 19 and Sept. 17, the Mission had 778 new cases (a rate of 132 new cases per 10,000 residents), while Bayview Hunters Point had 917 cases for a rate of 242 new cases per 10,000 residents. Bayview Hunters Point is the only neighborhood with a rate of over 200. Of 38 SF neighborhoods, 21 had case rates over 100 per 10,000 residents, of which 13 were in the east and southeast sectors of the City..
DPH reports that, for the week ending Sept. 14, the seven-day rolling average of daily new cases in the city was 108 new cases, or approximately 12.3 new cases per day per 100,000 residents (based on an 874,000 population). According to the latest from DPH on Sept. 10, the 7-day average case rate among fully vaccinated residents was 8.5 per 100,000 fully vaccinated residents and 19.8 per not fully vaccinated 100,000 residents.
So far in September, Whites have had 35.1 percent of recorded infections, Asian residents had 22.7 percent, Latinxs 18.8 percent, Blacks 8.6 percent, Multi-racials 2.1 percent, Pacific Islanders 1.7 percent and Native Americans .4 percent of the month’s recorded infections.
So far in September, Native Americans have a 3.7 percent positivity rate, Pacific Islanders 3.6 percent, Latinxs 3.5 percent, Blacks 2.9 percent, Whites 2.1 percent and Multi-racials have a 1.5 percent September positivity rate.
Covid-related deaths in San Francisco are always difficult to ascertain. In the last few days, DPH added 4 more deaths in August, for a total of 34 August deaths, and 1 new death in September, for a total of 4 so far, bringing the cumulative covid-related death toll to 612. DPH says there are now 9 deaths of fully vaccinated San Franciscans “that are due to complications from COVID-19.”
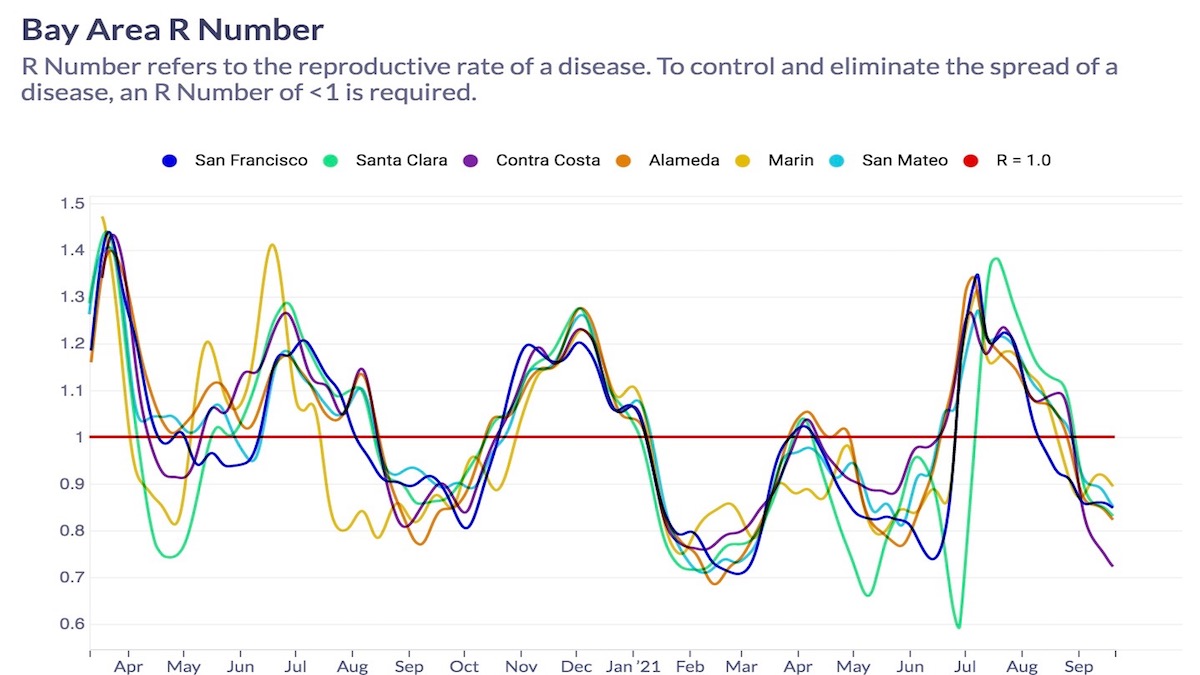
Covid R Estimation has left its estimate of the San Francisco R Number at .85 while slightly lowering its estimate for the California R number to .88. All models in the ensemble estimate the San Francisco R Number below .9, with an average of .73, while the average California R Number has fallen to .75. The ensemble average estimate for San Francisco has been below 1 since Aug. 3 and for California below 1 since August 30.
The overall population percentages have changed due to the 2020 Census. For the time being, we will continue to use use the figures provided by SFDPH. So far in September, SF residents between 0-4 account for 3.2 percent of the month’s recorded infections, those 5-10 6.4 perecent, those 11-13 2.1 percent, those 14-17 1.6 percent, those 18-20 2.5 percent, those 21-24 8.5 percent, those 25-29, 14.3 percent, those 30-39 23 percent, those 40-49 13.8 percent, those 50-59 10.7 percent, those 60-69 7.8 percent, those 70-79 and 3.8 percent, and those 80 and above accounted for 2.3 percent of September cases.