
Good Morning Mission, and welcome to Virus Village, your daily Covid-19 data dump.
Covid Tracker will continue with full graphs and minimum commentary unless circumstances warrant otherwise.
Should children continue to mask up this summer? The CDC thinks so, but others say it’s not called for. As usual, everyone is “following the Science.”
As the Covid pandemic recedes in SF, new efforts emerge to prevent an eviction pandemic.
Scroll down for today’s Covid numbers.
The CDC data used for the chart lags behind the data supplied from SFDPH. As of May 26, DPH reports over 77 percent (609,603) of San Francisco residents over 12 had received one dose, and 65 percent (513,051) are completely vaccinated. On May 26, the seven-day rolling average of shots per day was 4,010. For information on where to get vaccinated in and around the Mission, visit our Vaccination Page.
After a couple days above .9, Covid-19 R Estimation lowered its estimate for the San Francisco R number back to .79 today. Its California estimate is .88. Half the ensemble‘s estimates for San Francisco remain above .9, with an average estimate of .79 The ensemble’s average California estimate is .77.
Between April 23 and May 22, DPH reports 52 new cases among Mission residents or a rate of 8.72 new cases per 10,000 residents. Bayview Hunters Point continues to be the City’s primary hot spot with 80 new cases and a rate of 21.39 new cases per 10,000 residents. The Citywide rate was 6.80 new cases per 10,000 residents.
For the week ending May 19, the seven-day rolling average of daily new cases in the City was 16 new cases, or 1.8 new cases per day per 100,000 residents.
Based on the group’s population, as of May 20, Pacific Islanders have had a May case rate of 37.12 (10 cases), Blacks 15.36 (67 cases), Native Americans 14.67 (2 cases), Latinx 7.46 (99 cases), Multi-racials 2.43 (9 cases), White 2.35 (83 cases) and Asians 2.31 (68 cases).
For the week ending May 23, the rate of weekly change in Covid positive patients was flat. During that week, the seven-day average availability of ICU beds was 34 percent and Acute Care availability was 27 percent. On May 23, DPH reports Covid patients comprised 2.8 percent of ICU occupancy and .6 percent of Acute Care occupancy and the City had 100 percent ICU and 100 percent Acute Care surge capacity.
The latest report from the federal Department of Health and Human Services shows last week SFGH had an average of 4 Covid patients and 81 percent ICU occupancy, while across the Mission, CPMC had an average of 1 Covid patient and 51 percent ICU occupancy.
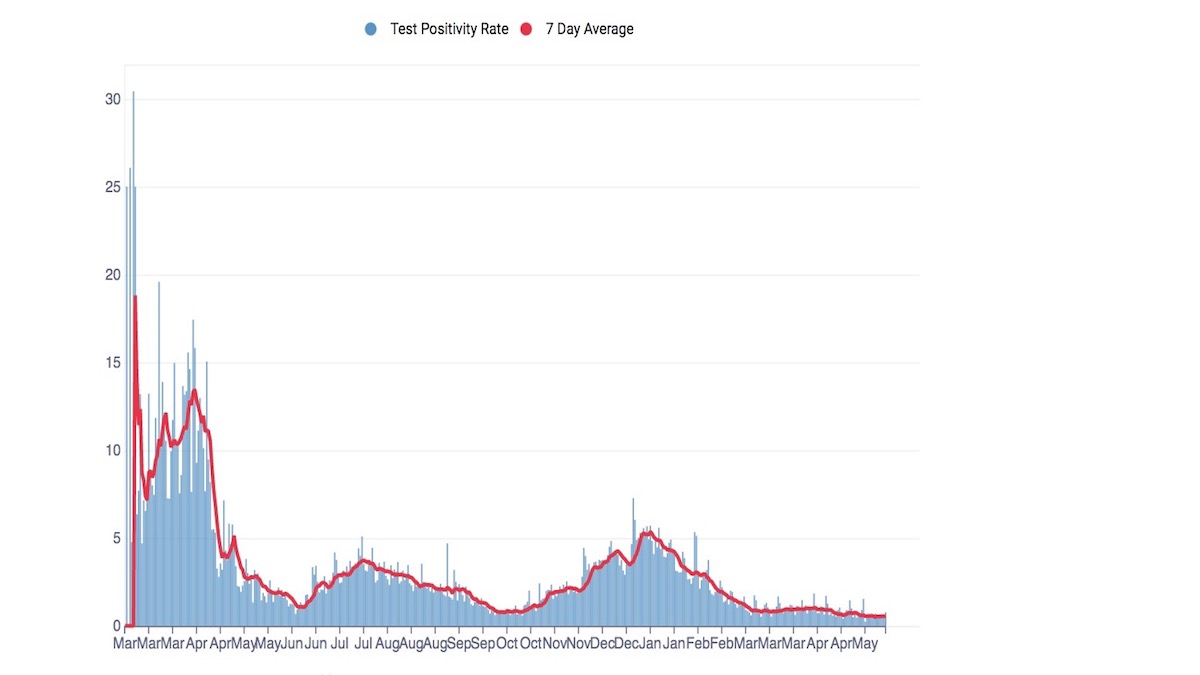
The Citywide positivity rate is back to .53 percent which is extremely low, but not as low as yesterday’s unbelievable 0.00 percent.
Undocumented workers are “essential” but are denied protection by employers and face “difficult if not insurmountable hurdles” in getting vaccinated.
DPH recorded the City’s second Covid-related death in May on May 8.