
Good Morning Mission, and welcome to Virus Village, your daily Covid-19 data dump.
Covid Tracker will continue with full graphs and minimum commentary unless circumstances warrant otherwise.
Scroll down for today’s Covid numbers.
The CDC data used for the chart lags behind the data supplied from SFDPH. As of May 24, DPH reports over 77 percent (606,594) of San Francisco residents over 16 had received one dose, and over 66 percent (507,469) are completely vaccinated. On May 23, the seven-day rolling average of shots per day was 5,186. For information on where to get vaccinated in and around the Mission, visit our Vaccination Page.
Uncertainty rules at Covid-19 R Estimation which bounced its estimate for the San Francisco R number, from the low 70’s last week to .92 today, in a range from .53-1.29. Its California estimate is .83. The ensemble‘s estimates are far more stable. All models continue to show San Francisco and California well below 1, both averaging at .78.
As of May 23, 69 percent of Mission residents (not just those 16 and older) have received at least one dose of The Vaccine. Neighborhoods with the highest vaccination rates include Japantown (79 percent) Mission Bay (78 percent) FiDi/South Beach (78 percent), Portola (76 percent), Excelsior (74 percent) and Bayview Hunters Point (72 percent). Neighborhoods with the lowest rates include Lakeshore (37 percent), Treasure Island (38 percent) and Presidio (51 percent).
For the week ending May 17, the seven-day rolling average of daily new cases in the City was 16 new cases, or 1.8 new cases per day per 100,000 residents.
Based on the group’s population, as of May 20, Pacific Islanders have had a May case rate of 37.12 (10 cases), Blacks 15.36 (67 cases), Native Americans 14.67 (2 cases), Latinx 7.46 (99 cases), Multi-racials 2.43 (9 cases), White 2.35 (83 cases) and Asians 2.31 (68 cases).
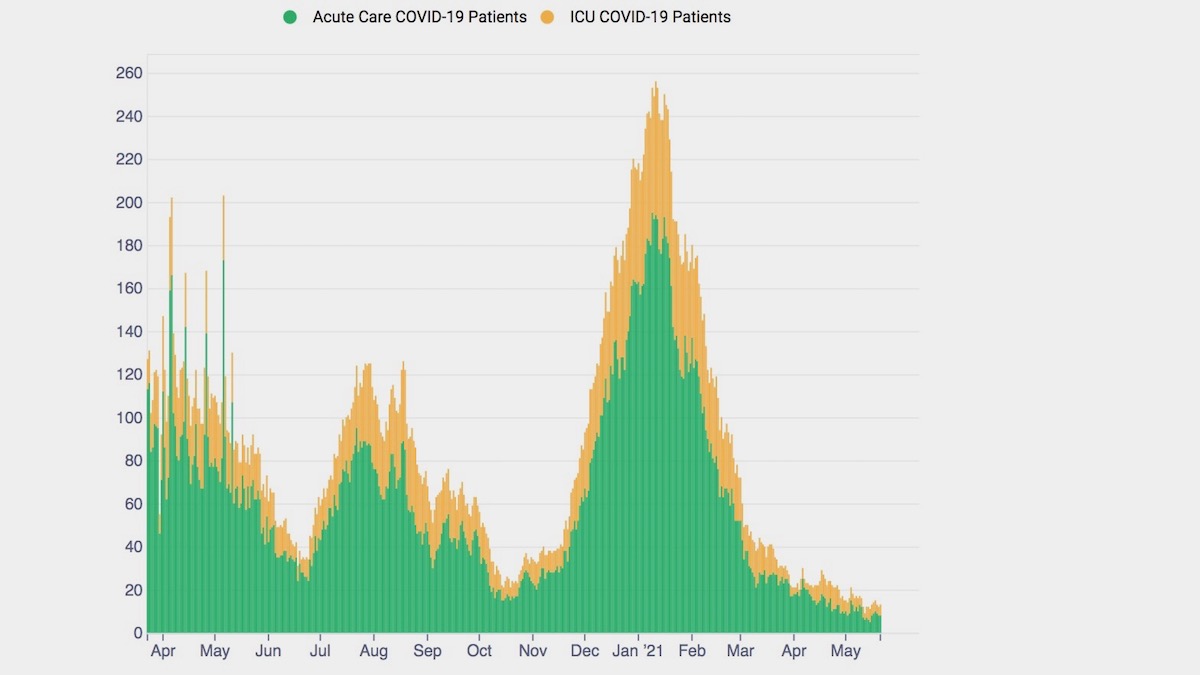
For the week ending May 21, though the raw numbers stay low and stable, the rate of weekly change in Covid positive patients rose 15 percent, . During that week, the seven-day average availability of ICU beds was 34 percent and Acute Care availability was 26 percent. On May 18, DPH reports Covid patients comprised 2.1 percent of ICU occupancy and .8 percent of Acute Care occupancy and the City had 100 percent ICU and 100 percent Acute Care surge capacity.
The latest report from the federal Department of Health and Human Services shows last week SFGH had an average of 4 Covid patients and 81 percent ICU occupancy, while across the Mission, CPMC had an average of 1 Covid patient and 51 percent ICU occupancy..
Between May 1 and May 20, Blacks had a positivity rate of 1.59 percent, Latinx 1.43 percent, Asians .39 percent and Whites .39 percent. The positivity rate for other groups was negligible.
DPH recorded the City’s second Covid-related death in May on May 8.