
Good Morning, Mission! Welcome to Virus Village, your daily Covid-19 data dump.
With new cases and the R Number plateauing, hospitalizations dwindle but deaths from the recent surge continue on an upward trajectory (our graph plotting deaths remains out of whack).
it shouldn’t take popular protest to get the City to aid those most vulnerable of us to the virus. But it does.
Vaccine supply and distribution are improving, but will we really reach “herd immunity”?
Covid is far from the only contributor to our over-stressed privatized hospital system. Reports from across the country show a dramatic increases in alchol-related admissions for critical diseases.
Crime news big this morning with reports on Mission Street break-ins and a curious disappearance. And check out what’s up this weekend. Happy Lunar New Year.
Scroll down for today’s Covid numbers.
Same numbers as yesterday. As of February 11, 15 percent (111,637) of San Francisco residents over 18 have received one dose, while over 4 percent (30,872 have received two. On February 11, 4995 shots were delivered, and the seven day rolling average of shots per day was 5352. The DPH goal is 10,000 shots per day. For information on where to get vaccinated in and around the Mission, visit our Vaccination Page.
Estimates for San Francisco’s R Number have plateaued around .85, one of the highest in the state. Previously hard hit counties like San Bernadino and Riverside currently record below .7 while the California R Number continues to average around .75
Between January 11 and February 9, DPH reported 409 new cases in the Mission for a cumulative total of 3794 cases or 63.6 cases per 1000 residents. The hardest hit neighborhood is the area bordered by 23rd and Cesar Chavez, South Van Ness and Harrison which has had a rate of 92.2 cases per 1000 residents.
The average new case numbers seem to be plateauing at an uncomfortably high level. For the week ending February 5, the seven-day average of daily new cases in the City rose to 146, or 16.8 new cases per day per 100,000 residents.
DPH doesn’t provide updates on race/ethnicity numbers until the 18th of the month.
Reflecting the drop in new cases over the past month, hospitalizations are now steeply declining. Today’s numbers include 2 ICU transfers, and 0 transfers in Acute Care. For the week ending February 11, the rate of weekly change in Covid positive patients dropped another 28 percent. During that week, the seven-day average availability of ICU beds was 29 percent and Acute Care availability remained 22 percent. On February 11, DPH reports 100 percent surge availability in both ICU and Acute Care. Covid patients account for 12 percent of ICU beda and 5 percent of Acute Care beds.
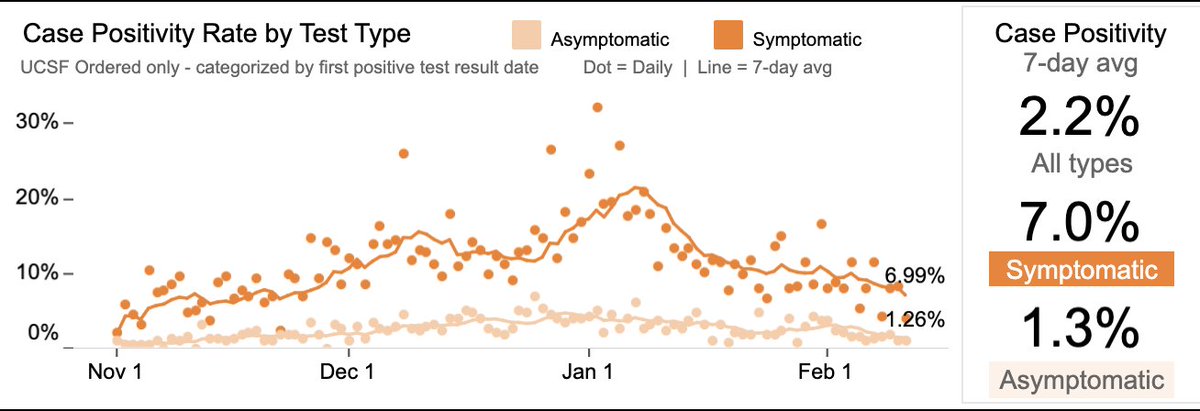
As the Citywide average positivity rate plateaus around 3 percent, UCSF’s Dr. Bob Wachter reports that at UCSF hospitals the positivity rate among asymptomatic patients is 1.3 percent. This number, a good sign Wachter says, is his “poor man’s way of guessing the odds that a person near me in a SF store has asymptomatic Covid.”
With SF schools on the cusp of reopening, DPH has a new School Page. As of December 27, students currently participating in in-person instruction have had a total of 15,831 positive tests, while staff has had 2,396. DPH estimates less than 5 in-school transmissions during 2020. Note: the figures in the graph above are current as of February 10, 2021.
Cumulative Covid Deaths in San Francisco

Since we’re having problems with the numbers on our Covid Deaths graph, here’s the DPH chart taken from their website: https://data.sfgov.org/stories/s/dak2-gvuj.
Track COVID-19 local and global coronavirus cases with active, recoveries and death rate on the map, with daily news and video. Track the global spread of coronavirus with maps and updates on cases and deaths around the world. As the virus that causes Covid-19 spreads worldwide, this dashboard offers a snapshot of confirmed cases by geographic location.