
The San Francisco Department of Public Health provides daily updates each morning. We will do the same.
The most recent numbers from the Health Department show the number of confirmed cases has increased by 12, and the number of deaths by one.
The fatality announced today was retroactively added with a date of May 8 — the same date of another fatality announced yesterday. We asked the Health Department yesterday why it took three weeks for that death to be released, and we’ll update you when we hear more.
Fourteen COVID-19 cases were added with confirmation dates of Friday and Saturday. Those dates are typically when COVID-19 tests returned positive. The number of cases on May 13 and May 27 also decreased by one each, which caused the cumulative total number of cases in San Francisco throughout the entire pandemic to rise by 12.
After a two-day hiatus, hospitalization data is once again being released by the city with the missing days filled in. The Health Department told us the delay was caused by a software bug and that the DataSF team implemented a workaround. The hospitalization numbers themselves still look good: The trend of either holding steady or making gradual declines continues.
The demographic trend continues to show an increasing disparity in who is getting COVID-19. Latinx residents– 15 percent of the city’s residents – account for nearly 50 percent of the city’s cases – 47.3 percent to be exact.
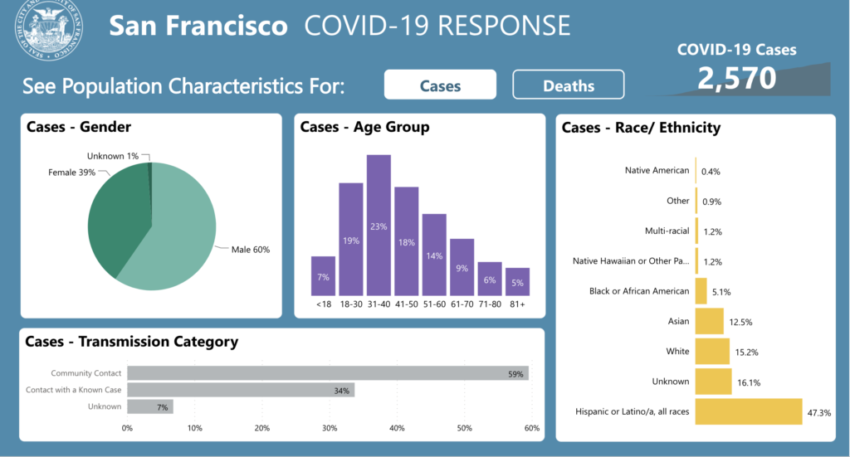
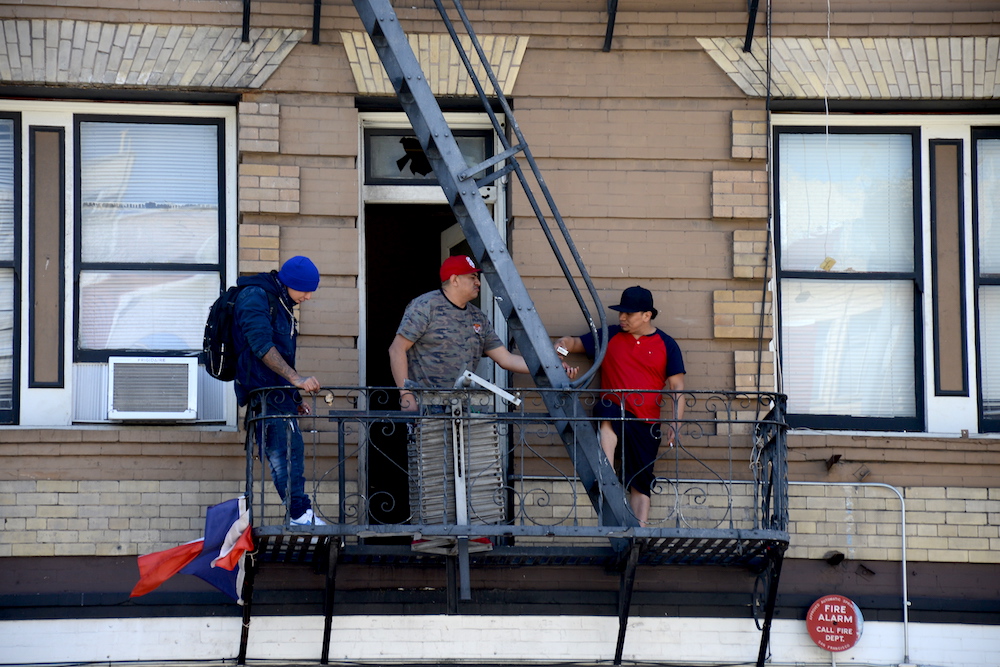
And the Mission District continues to be overly represented in COVID-positive cases with 380 total or 51.53 per 10,000 residents compared to a citywide rate of 26.84.
By and large, the numbers show what researchers at UCSF discovered in their Mission District study: low-income, working-class residents who have no choice but to work and return home to crowded households, are most vulnerable to the virus. Doctors at ZSFGH noticed early on that some 80 percent of the COVID patients were Latinx compared to 35 to 40 percent during normal times.
Our data tracker is embedded below, or click here for a full-screen version. And, you can find all of our recent daily tracker stories here.
Producing all of this content keeps us busy and if you haven’t already, please support our efforts.
Please note:
The embedded data tracker below will continue to be updated daily after this post is published.
For the number of confirmed cases each day, our tracker is tracking the date on which the Health Department announced new confirmed cases, not the date which the department said those cases were confirmed on.
There is a discrepancy between the total number of positive test results reported by the city and the total daily number of confirmed cases. The discrepancy comes from a delay in fully investigating positive test results. In doing so, health investigators find some duplicates and some are for people who live outside of the city, according to epidemiologists at the Department of Public Health. New cases are only added to the daily confirmed cases after an investigation is completed.
Also, there is also a discrepancy between the hospitalization data reported by the San Francisco Department of Public Health (SFDPH) and the county hospital data reported by the California Department of Public Health (CDPH). This is because SFDPH receives data from one additional hospital, San Francisco VA Health Care System, that is not required to report to CDPH. “SFDPH statistics will trend higher as long as this hospital has patients admitted as either COVID-19 positive or suspected COVID-19 positive.”
Hi I just wanted to say thank you for presenting the data in such a clear and helpful manner. I prefer your ‘dashboard’ graphs to those put out by the SFDPH- all in one place, showing %s and deltas. Well done.