
Good morning, Mission, and welcome to Virus Village, your (somewhat regular) Covid-19 data dump.
Hospitalizations have slowly begun to fall, while infection numbers and positivity rates take more significant dips. R Number models continue to show San Francisco at or below 1.
The lack of insurance and affordable health care have left many of those most vulnerable to Covid-19 “swamped” by medical debt. To ensure this problem will remain, the supermajority of Democrats in the California assembly have killed this year’s version of single-payer without even taking a vote. Unmoved by the obvious cowardice of elected officials, others vow to keep fighting.
Big promises leading to no action is nothing new. However, the lack of any semblance of sanity with respect to curbing covid in federal prisons is still noteworthy.
San Francisco’s Department of Public Health has kept the number of vaxxed and unvaxxed hospitalizations a secret since September. Does this imply a lot of vaxxed in SF hospitals? Given the high number of “up to date” residents, it would not be a surprise, nor should it be interpreted to mean that The Vaccine doesn’t work.
Many experts, officials, parents and teachers have argued about restrictions/mandates in place to protect students. Rarely do we hear from the students. At the University of California, Los Angeles, some have taken to sitting in (welcome back, 1968) to demand online options, while in Oakland, some high school students launched petititon drives to improve school safety.
In the midst of the omicron surge, with the more contagious “stealth” omicron on the way, it may seem a bit unsettling to speak about getting back to “normal.” It would be folly (but not unusual) to ignore the lessons of history, as well as ignoring the “endemic” nature of the virus.
Why do Americans distrust public health institutions? There are probably many reasons, but when one of the leading agencies, time and again, decides to hand over billions to private companies without sufficient, or any data, it strains credibility.
And take a look at the contract between Pfizer and the federal government, which paid for the research, for Pfizer’s new (still scarce) antiviral drug.
Scroll down for today’s covid numbers.
The U.S. Centers for Disease Control data used for the chart lags behind the data supplied from the San Francisco Department of Public Health. As of Feb. 1, DPH reports 779,441 residents, more than 89 percent of all San Francisco residents have received one dose, and over 82 percent have received two. For residents 5 and older, DPH reports the figures rise above 90 percent and above 86 percent while for those 65 and older over 90 percent have received two doses. SFDPH reports that as of Feb. 1, approximately 457,933 SF residents (64 percent of all residents) have received a COVID-19 booster dose.
For information on where to get vaccinated in and around the Mission, visit our Vaccination Page.
On Jan. 29, DPH reports there were 247 covid hospitalizations, or about 28.2 hospitalizations per 100,000 residents (based on an 874,000 population). Hospitalizations hit a high of 286 on Jan. 25. Today, the California Department of Public Health reports 250 covid patients in SF hospitals with 48 in ICU.
The latest report from the federal Department of Health and Human Services shows Zuckerberg San Francisco General Hospital with 46 covid patients and 1 ICU bed available, while across the Mission, CPMC had 22 covid patients and 2 ICU beds available. Of 287 reported covid patients, 133 were at either SFGH or UCSF, with at least 54 ICU beds available among reporting hospitals (which does not include the Veterans Administration). The California DPH currently reports 79 ICU beds available in San Francisco. Note: The Government Accountability Office GAO) has issued a scathing report for sustained public health crisis failures at HHS. The failures cited include “collecting and analyzing data to inform decisionmaking.”
Note: DPH uses dated population figures for neighborhoods. Between Nov. 29 and Jan. 28, DPH recorded 3825 new infections among Mission residents or 651 new infections per 10,000 residents. Despite over 90 percent of its residents having at least 2 doses of The Vaccine, Bayview Hunters Point has the highest number of recorded new infections (4250) with an incredible rate of 1121 new infections per 10,000 residents. Of 38 neighborhoods, 15 had rates above 600 per 10,000 residents, 14 of which were in the east and southeast sectors of the City.
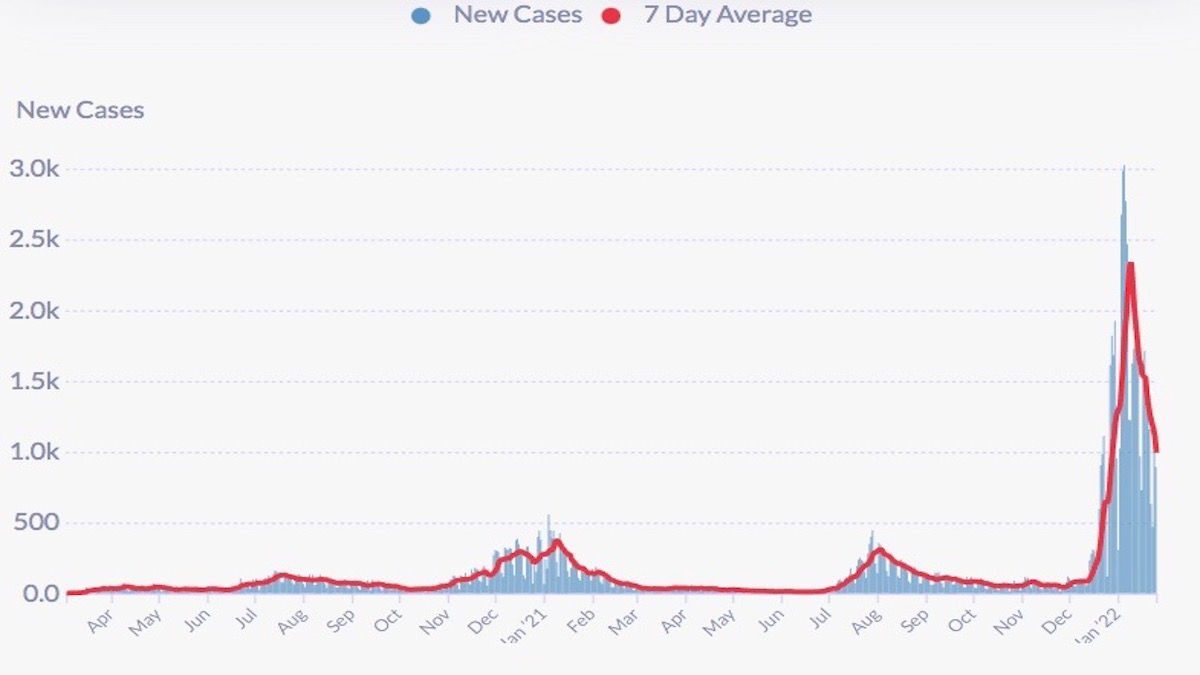
On Jan. 28, the 7-day average of daily new infections recorded in the City was 993 (down from a peak of 2238 on Jan. 9) or approximately 113.6 new infections per day per 100,000 residents (based on an 874,000 population). According to DPH, the 7-day average infection rate among vaccinated residents on Jan. 18 was 97 per 100,000 vaccinated residents and for unvaccinated residents, 267.1 per 100,000 unvaccinated residents.
As of Jan. 26, DPH reports that throughout the pandemic, based on size of population groups, Pacific Islanders have had an infection rate of 4,349 infections per 10,000 residents, Latinxs 2,321, Native Americans 2,001, Blacks 1,768, Whites 828 and Asians have had an infection rate of 805 infections per 10,000 residents.
As of Jan. 28, San Francisco’s Latinx residents had a 26.4 percent positivity rate in January, Pacific Islanders 22.2 percent, Blacks 21.2 percent, Multi-racials 18.7 percent, Native Americans 18.5 percent, Asians 14.8 percent, and White San Franciscans had a 12.5 percent positivity rate in January.
Two more covid-related deaths have been reported in January. What is a covid-19 death, or a “covid-related” death? Who knows? DPH used to provide a definition that was broad and ambiguous. Last year, it scrapped that definition. If there is any agreed-upon standard in the City, and how that standard compares with other jurisdictions, it is a closely guarded secret.
Covid R Estimation lowered its San Francisco R Number estimate again to .79 while keeping its California R Number at .88. The ensemble lowered its average San Francisco R Number to .66 while raising its average California R Number to .67. All models in the ensemble today show SF well under 1.
As of Jan. 28, there have been 20,419 infections recorded among SF females (or 50 percent) in January and 19,527 infections recorded among SF males (or 47.8 percent) in January. Trans females recorded 11 infections and trans males 9 infections. The rest were either unknown or “Other”.
The web sites for getting booster or getting tested are still garbage. I’ll fill out a long application with redundant questions and then hit the submit button and it says “service not available” and all the data I entered disappears. Whoever they hire to program these pages don’t even have enough basic knowledge to know they should be embarrassed by their work. Ask the website for a list of places with specific vaccines and they just give you the same unsorted list that may or may not have what you want, that may or may not even be in your city.
And deaths skyrocket. Deaths are up 375% over two weeks ago. And hospitalizations are up 46% in that time period.
The devil is in the details and I’m not sure I like the average of .66 and .67