
Good morning, Mission, and welcome to Virus Village, your (somewhat regular) Covid-19 data dump.
Did someone hit the pause button? Hospitalizations, positivity rates and case numbers show a plateauing over recent days. A relatively high plateau. Maybe the virus is taking a break, or there’s a reporting problem. In any case, there’s plenty of covid going around.
Expect more vaccine mandates (and booster mandates?) on the way, as the FDA has given full approval to the Pfizer vaccine and the Moderna one should be approved soon.
From the earliest days, response to the pandemic here and around the country has been plagued by an inefficient, privatized and profit-oriented health care system. Today, when cheap, accurate, at-home tests are needed as much or more than ever to stem the Delta surge, we can’t find any. Why? Because Abbot Labs discontinued the program and destroyed their inventory in the spring when case numbers were low. “This is all about money,” a site manager for Abbot Labs told his workers as he laid them off, according to the New York Times.
Will the booster rollout, like the vaccine rollout, be managed by private consultants and companies? They did a heckuva job last winter.
And here’s a good one on profit-gauging hospitals and private health insurance. Interesting, but far from shocking, as we’ve known about it for decades. I haven’t heard anything recently from the Biden Administration about the “public option.” Have you?
“Following the science” seems to mean different things to different people. For some it means easy money, while for others it means vaccine nationalism.
No worries. Pfizer has already begun marketing a new pill to treat covid, though it may not be available until the end of the year. No reports yet on cost to taxpayers and/or patients.
In a different vein, here’s another preprint on “breakthrough infections” indicating the degree of protection provided by the vaccines.
Scroll down for today’s covid numbers.
The U.S. Centers for Disease Control data used for the chart lags behind the data supplied from the San Francisco Department of Public Health. As of Aug. 22, DPH reports over 78 percent of all San Francisco residents have received one dose, and over 72 percent are completely vaccinated. On Aug. 22, the seven-day rolling average of shots per day to new recipients was 610. For information on where to get vaccinated in and around the Mission, visit our Vaccination Page.
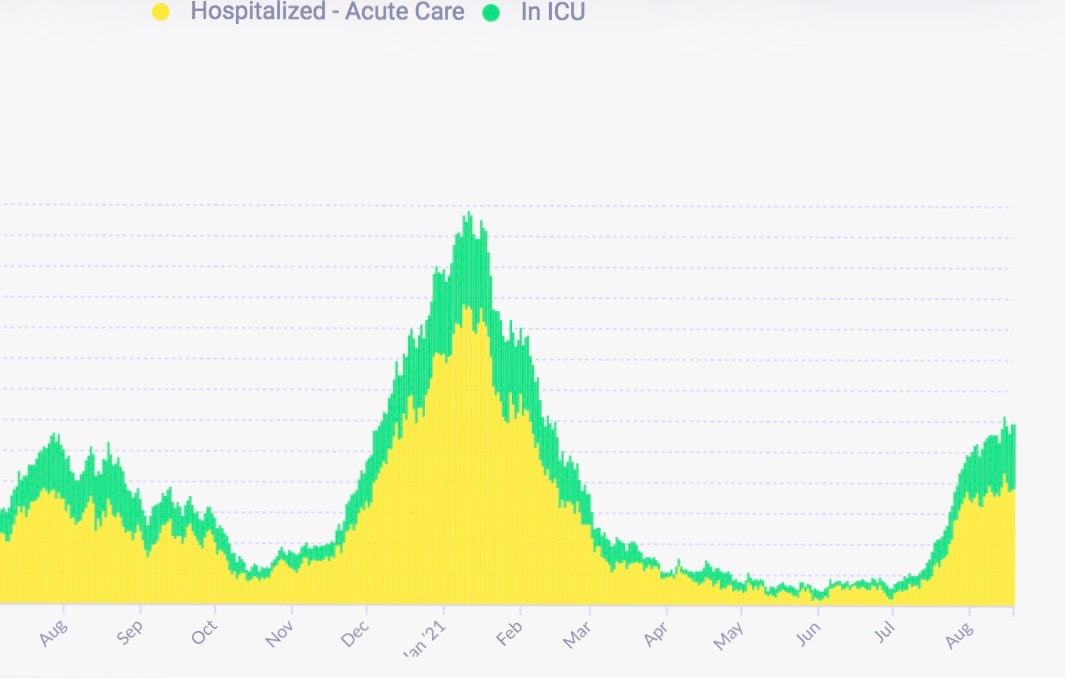
On Aug. 19, DPH reports there were 118 hospitalizations, 76 in acute care, 42 in the ICU. The latest update from DPH says 45 fully vaccinated San Franciscans have been hospitalized (a rate of 10.9 per 1,000, compared to 79.3 per 1,000 for those not fully vaccinated) . According to the CDC , for the seven days ending Aug. 20, there were 92 new admissions to San Francisco hospitals, a 4.55 percent increase over the prior seven days. Again, relying on CDC data (as SFDPH no longer bothers), for the week ending Aug. 20, covid patients accounted for 6.13 percent of hospital beds (no change) and 14.19 percent of ICU beds (up .56 percent).
The latest report from the federal Department of Health and Human Services shows SFGH with 17 covid patients and 76 percent ICU occupancy, while across the Mission, CPMC had 14 covid patients and 71 percent ICU occupancy. Of 110 reported covid patients, 55 were at either SFGH or UCSF.
Between June 19 and Aug. 18, DPH reported 643 new cases among Mission residents (or 109 new cases per 10,000 residents) and 704 new cases in Bayview Hunters Point (186 new cases per 10,000 residents). During this period, only the Mission and Bayview Hunters Point had more than 600 new cases. Five neighborhoods had more than 300 new cases, including the Castro, SOMA, Western Addition, Tenderloin and Sunset/Parkside. The Castro also had the second highest rate, at 158 new cases per 10,000 residents.
For the week ending Aug. 15, the seven-day rolling average of daily new cases in the city was 171 new cases, or approximately 19.8 new cases per day per 100,000 residents (based on 896,000 population).
As of Aug. 18, white San Franciscans had 1,174 new cases; Latinx, 743; Asians, 566; Blacks, 382; Multi-racial residents, 53; Pacific Islanders, 48; and Native Americans had 8 new cases. Counting the “other” and the “unknown” there have been approximately 3,335 new cases in August.
So far in August, DPH reports Latinx residents with an 8.8 percent positivity rate, Blacks with 7.2 percent, Pacific Islanders with 6.9 percent, whites with 4.3 percent, Asians with 2.8 percent and Multi-racial residents at 2.8 percent. DPH provides no data on August testing numbers or rates for population groups.
Deaths in San Francisco are always difficult to ascertain. Now DPH reports 11 covid-related deaths in July and six so far in August, bringing the total covid-related death toll to 577. DPH provides no demographic data for monthly deaths. Those 70 and above still account for approximately 75 percent of the City’s covid-related deaths. Although not tracked over time, and approximately 3 percent of all covid-related deaths have had one or more underlying condition, and in nearly 35 percent of the deaths, the presence of an underlying condition is unknown.
Covid R Estimation has lowered its San Francisco R Number to 1.07, and its estimate for the California R number remains at 1.27. Meanwhile, most models in the ensemble estimate the San Francisco R Number below 1, with an average of .85, while the average California R Number is 1.07.
So far in August, San Franciscans aged 0 to 4 had 3 percent of the new cases; 5 to 10, 4.8 percent; 11 to 13, 1.7 percent; 14 to 17, 2.2 percent; 18 to 20, 2.3 percent; 21 to 24, 8.9 percent; 25 to 29, 15.9 percent; 30 to 39, 25.4 percent; 40 to 49, 14.4 percent; 50 to59, 10.8 percent; 60to 69, 6.3 percent; 70 to 79, 3 percent; and those of us aged 80 and above account for 1.4 percent of the new cases.
Thank you for keeping up this reporting, Mark. Here’s a bit more information to consider: With the return to in-school learning, SFUSD is posting information regarding COVID testing/reporting at https://www.sfusd.edu/covid-19-response-updates-and-resources/health-and-safety-guidelines/when-someone-gets-sick/covid-19-testing-dashboard
We’re at 64 known cases after the first week of in-person school for PK-12.