
Good Morning Mission, and welcome to Virus Village, your daily Covid-19 data dump.
Daily average new case numbers have fallen to all time low in the City.
Numbers are not alone in falling.
San Francisco has got great outdoor space. For the wealthy.
Here’s another national story on how great SF is doing with Covid (relatively speaking). Unlike earlier PR pieces, this one actually reports the slow response to the disparities which were driving the numbers and hospitalizations.
Scroll down for today’s Covid numbers.
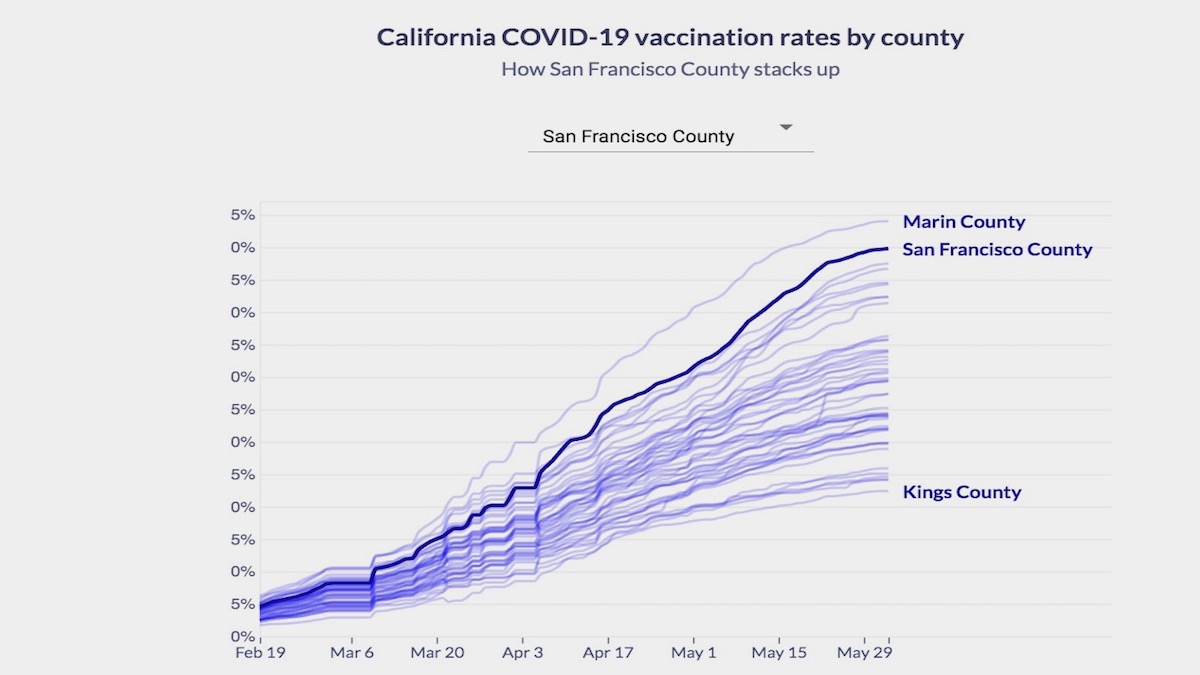
The CDC data used for the chart lags behind the data supplied from SFDPH. As of June 2, DPH reports over 78 percent (617,230) of San Francisco residents over 12 have received one dose, and over 66percent (523,422) are completely vaccinated. On June 1, the seven-day rolling average of shots per day was 2,113. For information on where to get vaccinated in and around the Mission, visit our Vaccination Page.
Covid-19 R Estimation lowered its estimate of the San Francisco R Number to .76, and its California estimate to .86. All the models in the ensemble estimate California below 1, with an average of .76. Most of the ensemble’s estimates for San Francisco are below .9, with an average estimate of .76.
Between April 30 and May 29, DPH reports 37 new cases in the Mission or a rate of 6.20 new cases per 10,000 residents. Bayview Hunters Point remains the City’s hottest Covid spot with 68 new cases or 18.18 new cases per 10,000 residents. The Citywide rate was 5.79 new cases per 10,000 residents.
For the week ending May 26, the seven-day rolling average of daily new cases in the City hit another new low with 13 new cases, or 1.5 new cases per day per 100,000 residents.
Some things don’t change. With new cases at an all time low, SF’s highly lauded contact tracing program should be on top of its game. Strangely (or not) the program has managed to reach about the same proportion of people who tested positive (79 percent) and their contacts (84 percent) has it has throughout the pandemic.
For the week ending May 30, the rate of weekly change in Covid positive patients rose 3 percent. During that week, the seven-day average availability of ICU beds was 34 percent and Acute Care availability was 27 percent. On May 30, Covid patients accounted for 2.45 percent of ICU occupancy and .19 percent of Acute Care occupancy, and DPH reports 100 percent ICU and 100 percent Acute Care available for a potential surge.
The latest report from the federal Department of Health and Human Services shows SFGH with 4 Covid patients and 83 percent ICU occupancy, while across the Mission, CPMC had 1 Covid patient and 51 percent ICU occupancy.
San Francisco is now collecting the fewest Covid tests since July 8.
There have been 0 reported Covid-related deaths in San Francisco since May 7. So far there are 3 reported Covid-related deaths May.