
Good Morning Mission, and welcome to Virus Village, your daily Covid-19 data dump.
While numbers are at all time lows in SF, Taiwan reminds us that what goes down can come back up.
When is the next public school year and what will it look like? Who knows? Joe has been trying to find out.
A big rally for Palestine on Saturday and say hello to Suraj Menon.
Scroll down for today’s Covid numbers.
The CDC data used for the chart lags behind the data supplied from SFDPH. As of May 16, DPH reports 76 percent (582,121) of San Francisco residents over 16 had received one dose, and 61 percent (466,490) are completely vaccinated. On May 16, the seven-day rolling average of shots per day was 6,082. For information on where to get vaccinated in and around the Mission, visit our Vaccination Page.
Covid-19 R Estimation has its estimate for the San Francisco R number back to .89, while slightly lowering its estimate for California around .92. All models in the ensemble show San Francisco and California below 1, with a San Francisco average estimate of .75, while California’s average estimate dropped to .85.
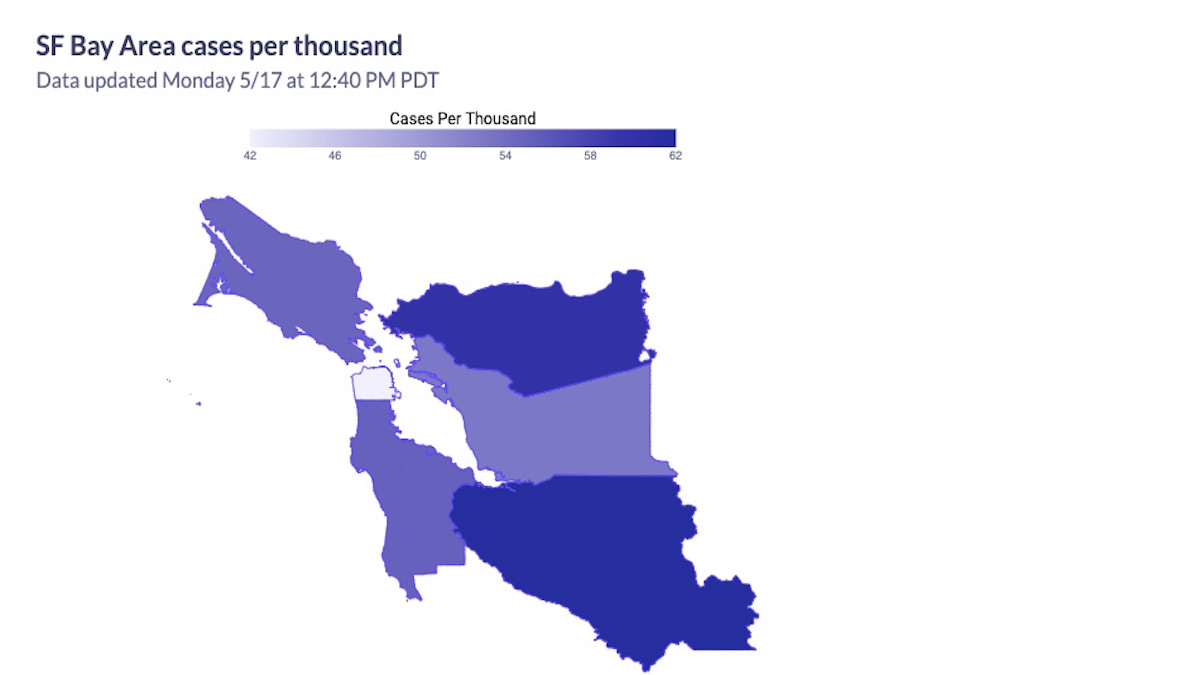
Between April 13 and May 12, DPH reports 68 new cases in the Mission or 11.4 new cases per 10,000 residents. Bayview Hunters Point remains the City’s hottest spot with 93 new cases over the past month or 24.9 new cases per 10,000 residents.
For the week ending May 9, the seven-day rolling average of daily new cases in the City was 21 new cases, or 2.4 new cases per day per 100,000 residents.
More than half (maybe 75 percent) of the nation’s farmworkers are undocumented, most from Mexico and Central America. It’s one of the most dangerous jobs in the country, and workers have been denied Covid protection, vaccination and basic healthcare.
For the week ending May 13, the rate of weekly change in Covid positive patients fell 40 percent. During that week, the seven-day average availability of ICU beds was 34 percent and Acute Care availability was 25 percent. On May 13, DPH reports Covid patients comprised 2.1 percent of ICU occupancy and .5 percent of Acute Care occupancy and the City had 100 percent ICU and 94 percent Acute Care surge capacity.
The latest data from the Federal Health and Human Services department shows last week that SFGH had 5 Covid patients and 83 percent ICU occupancy..
The Citywide average positivity rate has been below 1 percent since April 11.
There have been 0 nursing home deaths reported in SF since January 19. There have been 0 new cases reported since April 17. In Single Room Occupancy Hotels (SROs) there have been 34 cases and 0 deaths since March 23.
San Francisco’s case fatality rate since April 1 is approximately .64 percent.
Taiwan’s vaccination rate is 4.6%