
Want to know more about San Francisco’s 11 city supervisors? Especially the official representing your district?
Our new lookup tool is a one-stop shop for anything you might need to get started lobbying for yourself at City Hall. Meet the supervisors’ legislative aides, and learn what the aides specialize in and how to get in touch.
Learn about your district’s demographics, voting rates, homeownership rates and more!
Read background on the most recent election, like who paid to get your supervisor into office and who paid to try to keep them out.
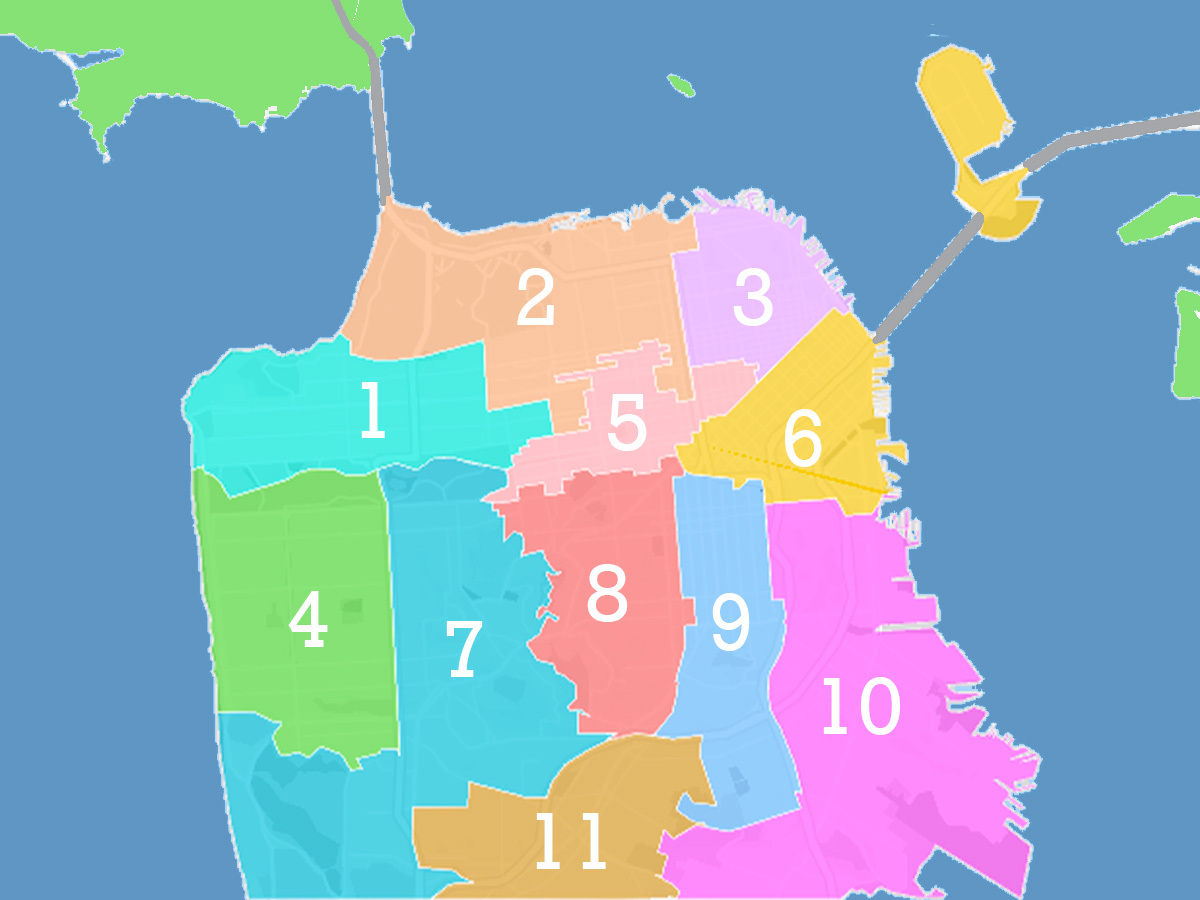
To navigate the tool, you can start by selecting a district from the drop-down menu over the map. That will take you to the supervisor district you’re interested in.
Once you’ve selected a district, you can zoom in and out of the map to explore the streets and boundaries of that district, and scroll down to find specific information about the district: When the local police station meets, ethnic breakdown, voting and homeownership rates, and more.
Methodology and data sources
Population and district demographics data comes from census data cited in a 2022 San Francisco redistricting presentation. Homeownership data is from the voter data and campaign software solutions firm Political Data Intelligence.
For campaign finance, we looked at the top outside spending — that is, spending by political action committees — for and against them in 2024. We did not include the spending supporting and opposing their opponents in those races. We also did not include the amount of money raised and spent on their own campaign committee, since contributions to a candidate’s committee are capped at $500 per donation. For more specific details, you can check out the San Francisco Ethics Commission’s dashboard for the November 2024 election.
Some of the five newly sworn-in supervisors have archived their campaign websites, so we used the Wayback Machine from the Internet Archive to find snapshots of their previous endorsements. In the endorsement section of the tool, you can click on “others” to see a PDF version of their full endorsement lists.
If you have any questions or spot any errors, please drop a line at xueer@missionlocal.com.
Illustrations by Neil Ballard.
This is GREAT! Follow the $$$$. Thanks Xueer Lu and Mission Local.
Bottom 20 percent of SF population is making an average income of $19,000 while the top 20 percent average $532,010. Billionaire Lurie has made his focus clear, it’s more Billionaire interests. So much for getting rid of London Greed, Dan kept her government entirely and is taking credit for not being her. He’s not so different at all.
Grow (Cancer) SF and all subsidiaries need to be excised by residents.
It’s not lost on anyone though: not one of the different 11 district supervisors is talking about their specific plans to avoid public transit service cuts to MUNI. Why not? Public transit impacts the daily lives of every single San Franciscan. SF’s Chief Economist Dr.Ted Eagan states “There will be no economic recovery in San Francisco without a strong vibrant MUNI.” MUNI NOW! MUNI FOREVER. NO SERVICE CUTS TO MUNI!!
MUNI can only become sustainable with cuts where they’re needed. Facts matter.