A week after the March 2024 election, the last few thousand ballots are being counted and the final results are all but assured. Digging deeper into the data can help us understand both this election, and maybe a little about the upcoming November contest.
1. Progressive voters carried Prop. A over the line
The city’s progressive faction had a bad election, not least because Propositions E and F, which loosen rules for police and require some welfare recipients to be screened for drugs, respectively, won handily. But one bright spot for progressives (and YIMBYs of all stripes) was the passage of Prop. A, which will free up $300 million in borrowing for the city to build affordable housing.
Ostensibly, most of the city was in favor of the proposition; the Republican Party was the only major political bloc to oppose it. But it was the voters who opposed Propositions E and F who ensured that Prop. A passed.
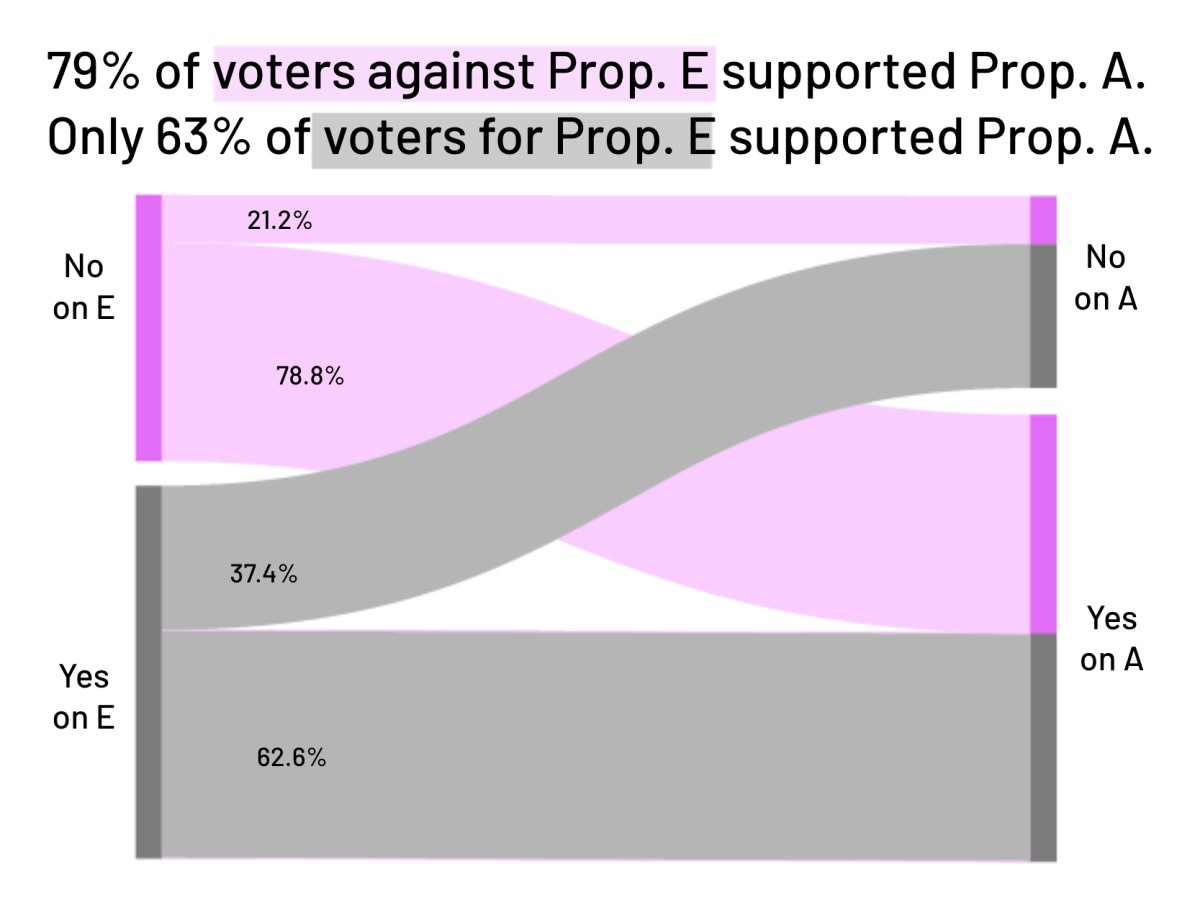
Some 63 percent of voters who supported Prop. E, and 61 percent of voters who supported Prop. F, supported Prop. A as well. However, Prop. A required 66.67 percent approval to pass, so these voters alone would not have passed the measure.
On the flip side, 79 percent of voters who were against Prop. E, and 82 percent of voters who were against Prop. F, supported Prop. A. Although in the minority, this anti-E-and-F progressive contingent voted strongly enough for affordable housing that the proposition passed, with 70.1 percent of the overall vote.

79% of voters against Prop. E supported Prop. A.
Only 63% of voters for Prop. E supported Prop. A.
21.2%
No
on A
No
on E
78.8%
37.4%
Yes
on A
Yes
on E
62.6%

79% of voters against Prop. E
supported Prop. A. Only 63% of
voters for Prop. E supported A.
21.2%
No
on A
No
on E
78.8%
37.4%
Yes
on A
Yes
on E
62.6%
82% of voters against Prop. F supported Prop. A.
Only 61% of voters for Prop. F supported Prop. A.
17.9%
No
on A
No
on F
82.1%
38.6%
Yes
on A
Yes
on F
61.4%
82% of voters against Prop. F
supported Prop. A. Only 61% of
voters for Prop. F supported A.
17.9%
No
on A
No
on F
82.1%
38.6%
Yes
on A
Yes
on F
61.4%
Data from the Department of Elections as of March 12, 2024. Charts by Will Jarrett.
It is worth noting that most Prop. E and Prop. F supporters did still vote for affordable housing. So a majority of voters in this election were willing to vote for affordable housing — and, at the same time, support policies that give more power to the police and put restrictions on welfare recipients.
Still, the significant minority that voted against a measure to increase affordable housing (Prop. A) could hint at future friction in the uneasy coalition between YIMBYs and more conservative tough-on-crime voters.
2. Turnout was … okay, but not great
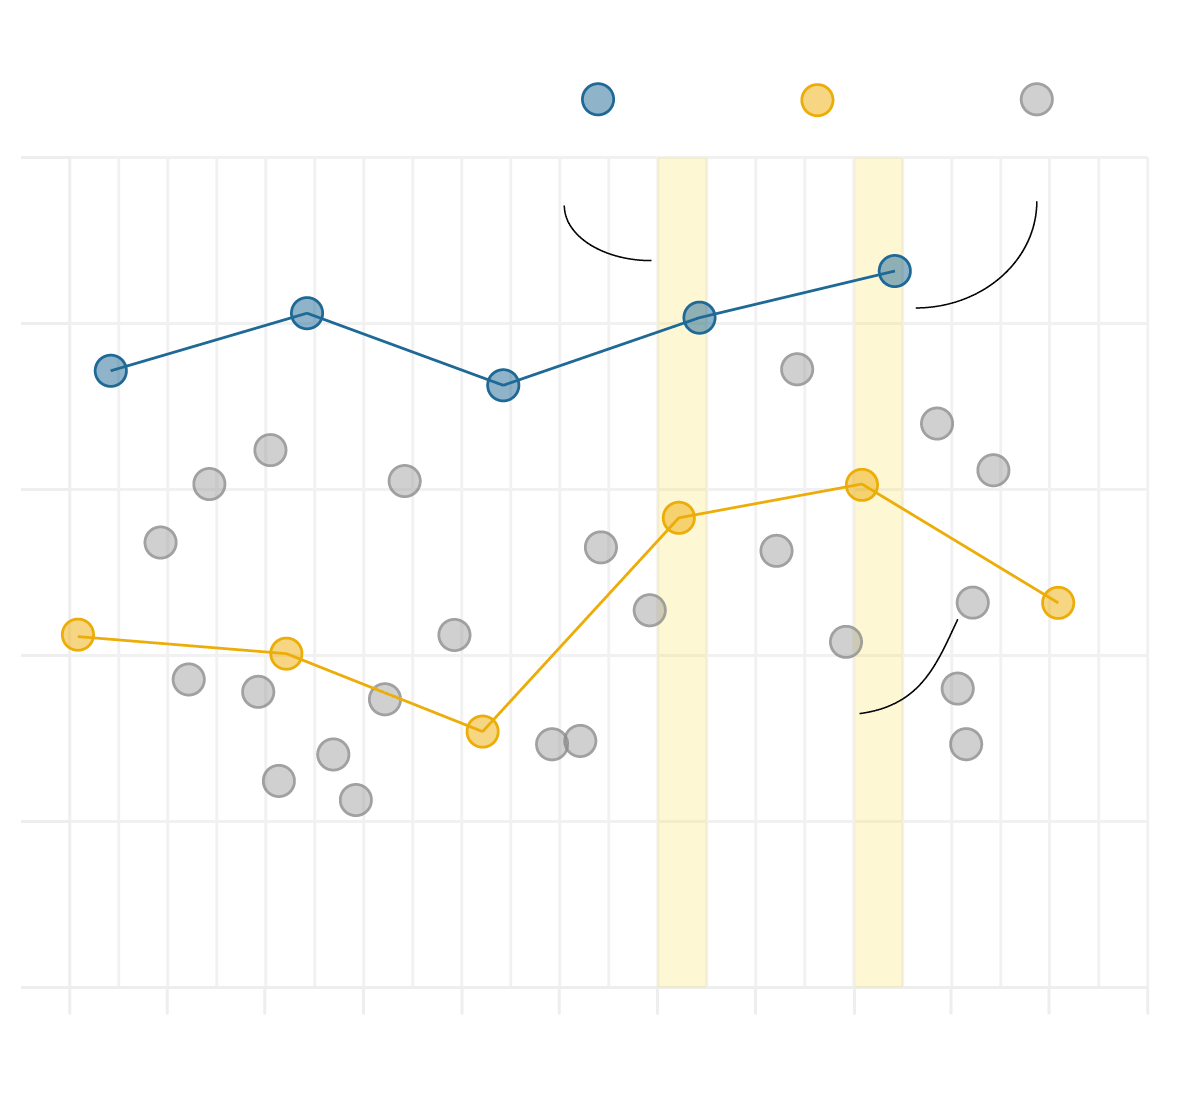
With a few thousand votes still to be tallied, exact voter turnout is not yet nailed down, but it looks as though we will land at roughly 46.3 percent (March 15 update: with all ballots counted, turnout landed at 46.6 percent). This is not high by any standard, but whether it is “middling” or “low” depends on what you compare it to.
Turnout was significantly greater last week than in two of the four San Francisco elections in 2022, and was roughly on par with the Chesa Boudin recall. It was higher than the presidential primaries in 2004, 2008, and 2012.
But the most recent two presidential primaries in San Francisco saw significantly higher turnout than last week’s election. In 2016, 56.6 percent of registered voters submitted a ballot, and in 2020 that rose to 60.6 percent. This was part of a general increase in voter turnout associated with greater interest in the presidential elections.
This month’s comparatively low turnout could have interesting implications if it were to carry over to November. But that race will have far more to draw voters to the polls, including several supervisorial races, the mayoral race and state and federal contests, so high turnout would not be at all surprising.
presidential
general
presidential
primary
Turnout rate %
others
100
Clinton v. Trump
Biden v. Trump
80
60
40
DA Chesa Boudin
recall
20
0
2004
2006
2008
2010
2012
2014
2016
2018
2020
2022
2024
2026

presidential
general
presidential
primary
Turnout rate %
others
100
Biden v.
Trump
Clinton v.
Trump
80
60
40
Chesa Boudin
recall
20
0
’04
’06
’16
’18
’20
’24
’08
’10
’12
’14
’22
‘26
Data from San Francisco Department of Elections as of March 12, 2024. Chart by Junyao Yang.
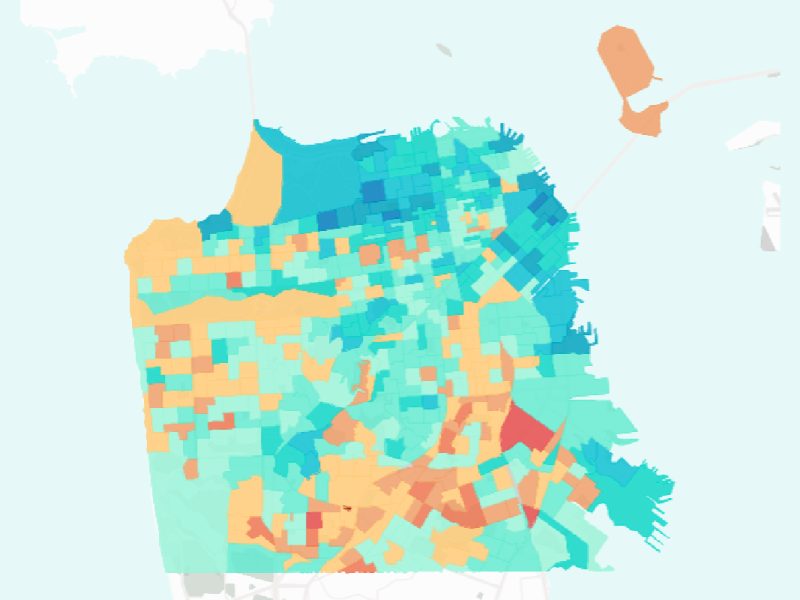
3. Propositions E and F found support in rich and poor areas
The most ardent supporters of Propositions E and F came from some of the most privileged areas of the city, with Seacliff and the Marina topping the list. But several more disadvantaged areas pulled for the measures as well: 68.5 percent of voters in Chinatown voted for E, for example, and 67.9 voted for F.
In the Tenderloin — an area at the center of the city’s fentanyl crisis, where approximately 30 percent of residents have a household income under $20,000 — some 60 percent of voters supported F, making them more in favor than the city at large. Similarly, 57 percent of Tenderloin voters supported E, compared to 54 percent of the city overall.
On the flip side, the neighborhoods most firmly opposed to Propositions E and F were the Mission and Bernal Heights.
You can drill down in explore precincts, districts, or neighborhoods using our interactive tool:
Data from the San Francisco Department of Elections. Updated March 13, 4:30 p.m. Chart by Will Jarrett.
4. More than a third of DCCC voters split their tickets
With two dozen seats up for grabs in the Democratic County Central Committee races, many candidates were not household names. That meant that most campaigning was done as part of a slate; all but three hopefuls were part of either the progressive Labor and Working Families slate or the Democrats for Change, which won 18 of the 24 available seats.
But a large chunk of voters split their ballots. Some 34.7 percent of voters voted for at least one candidate from each slate. Some 39.3 percent of voters only voted for members of the Democrats for Change, and roughly 25.7 percent voted for just Labor and Working Families families.
This may indicate that name recognition, on top of slate membership, is a very significant factor to many voters. While many of the successful Democrats for Change candidates were relatively unknown, suggesting that strong support for the slate got them over the line, four of the six progressives elected to the committee — Connie Chan, John Avalos, Jane Kim and Gordon Mar — are either supervisors or ex-supervisors.
In a higher-turnout November election, which will likely involve a greater proportion of less-informed voters and will include many more races, name recognition may become even more important.
5. The DCCC can give (imperfect) clues about November
Several candidates for the Democratic County Central Committee in last week’s election are also standing for supervisorial seats in November. By taking a look at how they performed in their districts last week, we can get a sense of how voters feel about them.
In District 1, three of the five prospective supervisors stood for DCCC last week. Marjan Philhour garnered the most local support, securing the support of 47.9 percent of District 1 voters. Incumbent Connie Chan, part of the Labor and Working Families slate, secured support from 41.2 percent of District 1 voters. The unaffiliated Jen Nossokoff trailed with 5.6 percent.
District 5 supervisorial candidate Bilal Mahmood also won a DCCC seat last week. He got the fourth-most votes in that supervisorial district — at least the half of it that was in his DCCC race. District 5 is split between Assembly Districts 17 and 19, and only the rightmost half could vote Mahmood for DCCC, so his popularity with March voters is not a one-to-one comparison to the electorate in November. Matt Dorsey, John Avalos and Jane Kim all secured more of the vote than he did in the same area.
District 9 supervisorial candidate Trevor Chandler was not at the top of vote-getters in the Mission, Bernal and Portola — where he will run in November. While he placed fifth in his DCCC race overall, he secured the support of just 36.9 percent of voters in District 9, coming sixteenth out of the 30 DCCC candidates in that district. Most popular in District 9 were progressives John Avalos, Jane Kim and Peter Gallotta.
It is worth bearing in mind that only registered Democrats were able to vote in this race, so the results are not necessarily reflective of the broader San Francisco electorate. It is also hard to read too much into a race where half the voters did not cast all of their votes, meaning they left ballot fields empty for certain candidates. There are currently 727,631 so-called “undervotes” in the DCCC race, likely an indication that voters were not hugely invested in the two dozen candidates running for this relatively obscure political body.
Those voters, however, are more likely to know the smaller pool of supervisorial hopefuls come November, changing the electorate and making March an interesting but imperfect predictor.

“On the flip side, the neighborhoods most firmly opposed to Props E and F were the Mission and Bernal Heights.”
I live in the stupidest neighborhood in the city. Sigh. Well, we have rent control. And fortunately the rest of the city outvoted us.
I live in Bernal and I’m proud we voted against both. Police chases across the city have literally killed people. Not giving a struggling drug addict food will make them more desperate.they aren’t going to suddenly get clean and we don’t have services in place. So I guess we cancelled each of our votes out.
Neither of those propositions propose substantive solutions and simply permit the Mayor to play politics with public safety concerns. I studied them carefully and voted not and urged anyone who asked me my opinion to vote no. Glad my neighbors are able to read and understand the political “fine print”,
Stupidity is repeating history and expecting different results. Time you studied early 20th century European history. People who vote in favor of a police state are stupid, in my opinion.
The neighborhood will tilt strongly towards anything identified as “against billionaires”.
Not to worry. Our current bogeymen exemplify the very last stages of end stage capitalism. Jackie Fielder is a shoe in and socialist nirvana is just around the corner.
Turnout during a primary where a Democrat incumbent faces no challenge, as in 2012, is always low. The increase between 2012 and 2024 can probably be explained by the intensive organizing and spending by the crypto swindlers. These people have had it turned to ’11’ for three years.
Can we stop with the narrative that YIMBY supports affordable housing? They want more housing in numbers with the same economic theory like trickle down that has been disproved for years. The affordable housing has been supported by most progressives and a lot of people in SF for decades. The issue is the city or developers just don’t build it.
Terrific piece, Will,
We’re missing you already.
Back to London ?
Boorrrrringg !
How long to gain the kind of esteem you’ve established in SF Jouralists ‘pack’ ?
Well, if it’s in the ‘Simulation’ can’t do much can we ?
lol
I think biggest difference for Mission is Adam Schiff as our new Senator.
He’ll listen and we’ll need that with the coming BOS Moderate Majority.
Imagine a Board prez, Matt Dorsey’s appointments to the Police Commission ?
Planning and Elections and Appeals commissions and on and on.
I’m supporting Roberto Hernandez for D-9 supe cause he knows the terrain and the people and is one of the majority (48%) cultures of our 80,000 residents.
Gimme Fielder for my 2nd Place in Ranked Choice but, frankly, she’s coming across as too entitled with a whiff of Matt Haney.
Hope I’m wrong.
Third Place I give to Michael Petrellis who offers some Contrast to the Race’s Feng Shui.
Go Niners !!
h.
We successfully recalled Hugo Chavez and Anti-Asian Hate Mongers but now we need to retire the Willie Brown Grifters in City Hall. Both groups are equally destructive to our city, caring only for their own ideological or grifting agenda and nothing for the public interest.
Conversely, there’s an alternative group which is funded by local business interests or self funded, Alas, the hobgoblins of capitalism, but at least they have the public interest in mind.
Food for thought: as of today, Thursday, March 14, 2024, the Department of Elections reports that 226,643 votes have been counted, with some 5200 remaining to be counted. It is estimated that there will be only 231,840 total votes for the 3/5/24 election. Turn out for this election was fairly low when compared to voter turnout in previous important election years (national presidential election years). In 2008, 388,112 votes were counted at a rate of 81.25% registered voter participation. In 2016, 414,528 votes were counted, at a rate of 80.71% of registered voters. And in 2020, 449,866 votes were counted at a rate of 86.33% registered voter participation. Let’s hope that November 2024, we have high levels of voter registration and participation.