Good morning, Mission, and welcome to Virus Village, your (somewhat) regular Covid-19 data dump.
Hospitalizations, recorded infections and positivity rates are considerably down. R Number models show local transmission below 1, and current wastewater monitoring shows the virus slightly rising in the southeast and falling in the west.
The Biden Administration’s vaccine-only strategy for fighting covid has taken a decided turn for the absurd. The top vaccine regulator for the U.S. Food and Drug Administration said the FDA has “extremely good data” showing that the shots are “safe and will be effective.” Where does that data come from? Apparently, the FDA will authorize more boosters based on studies involving mice. Yes, this is how they evaluate the safety and effectiveness of the annual flu vaccine (who knew?). No, covid is not the same as the flu, and the mice have not received four previous shots. Here’s a preliminary look at some of this booster’s pros and cons.
It would be funnier if the Administration was not expecting 100 million covid infections in the U.S. this fall/winter. Boosters have not been popular among eligible Americans, and with officials consistently signaling that transmission and circulation are of no concern, there is a question as to how many will choose to be boosted again.
While there are plenty of questions involving the new booster, which Covid Tracker has previously linked to, here’s a new set of interesting questions without answers.
Confused as to whether to get the new booster and when? Join the club. Here are some ways to think through the problem.
The Trump Administration pushed development of the initial vaccine with Operation Warp Speed. The Biden Administration seems to be content with Operation No Speed when it comes to the development of a vaccine that might actually prevent infections. Note that Cuba has already begun clinical trials (with human subjects) on a nasal vaccine.
A couple of weeks ago, the U.S. Centers for Disease Control and Prevention loosened their covid guidelines, giving no particular scientific reason. This was justified by a number of pandemic pundits as adjusting guidance “to meet where most Americans are.” Is this political science? Or simply what public health means today?
Shortly after its revision, CDC director Rachel Walensky acknowledged the CDC’s failure to prevent or control covid, and launched a bureaucratic response. The problem may go deeper than revising the organization chart, as it comes from the director of the nation’s foremost public health institution, who famously said last year, “your health is in your hands.”
If you believe the CDC can learn from its mistakes, best not to look at its recent responses to monkeypox and polio outbreaks.
For those most vulnerable to covid, the ideological foundation of the official “do nothing” policy to mitigate the virus transmission smacks of eugenics. That may be extreme. On the other hand, it may not, given Dr. Walensky’s view this past January that “[t]he overwhelming number of deaths, over 75%, occurred in people who had at least four comorbidities. So really, these are people who were unwell, to begin with. And yes, really encouraging news in the context of omicron.”
Are we really beginning to understand “long covid“? If it’s true that one of every five infections will result in some form of long covid, that’s a lot of very unhealthy people around. What are the long-term consequences for families, workplaces, basketball games and hospitals?
In one Sonoma County hospital, it doesn’t look good.
It seems like we won’t have Dr. Fauci to kick around for very long. Does his retirement mark the end of an era in public health?
Scroll down for today’s covid numbers.
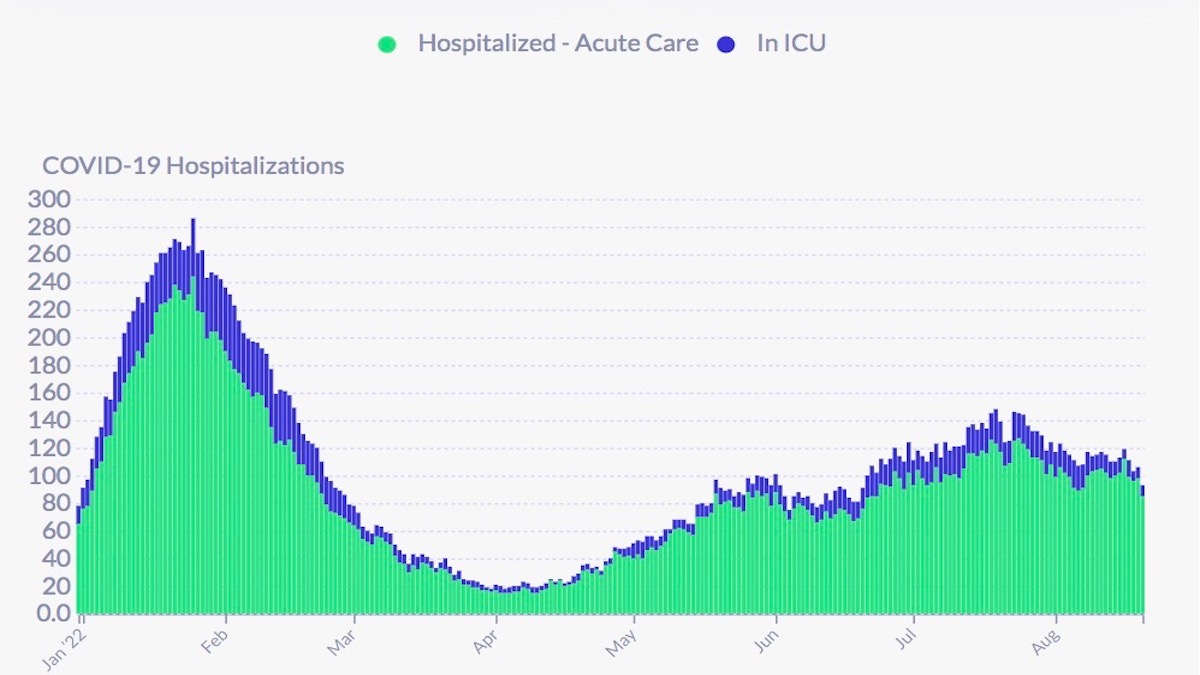
Hospitalizations are reported below 100 for the first time since June 20. On August 20, the San Francisco Department of Health reported 93 covid hospitalizations, or about 10.6 covid hospitalizations per 100,000 residents (based on an 874,000 population). ICU patients have been below 10 for the past few days. The California Department of Public Health reports as of August 23, there were 93 covid patients in SF hospitals with 12 patients in ICU. For the week ending August 21, the CDC says there were 78 new admissions, an increase of 8.8 percent decrease from the previous week. The CDC won’t say (like state and local officials) which hospitals are included in their survey. DPH does not report on admissions, nor does it report on covid positive patients who were hospitalized “for” covid, and those hospitalized “with” covid.
The latest report from the U.S. Department of Health and Human Services shows Zuckerberg San Francisco General Hospital with 19 covid patients and 16 ICU beds available, while across the Mission, CPMC had 13 covid patients and 4 ICU beds available. Of 130 reported covid patients in the City, 52 were at either SFGH or UCSF. Usually, the two hospitals generally account for 50 percent or more of the covid patients. This has not held during the recent wave. At least 80 ICU beds are available among reporting hospitals (which do not include the Veterans Administration or Laguna Honda). The California DPH reports that as of August 23, SF had 110 ICU beds available. Whether those beds are actually “staffed” neither the city nor the state will say.
Between June 20 and August 19, DPH recorded 1,150 new infections among Mission residents (a decrease of 28 percent from our last report) or 196 new infections per 10,000 residents. During that period, Bayview Hunters Point had the highest rate at 341 new infections per 10,000 residents. Of 38 neighborhoods, 18 had rates above 200 per 10,000 residents, 14 in the east and southeast sectors of the City. Lakeshore, the least vaccinated neighborhood, had a rate of 147 per 100,000 residents
DPH reports on August 16, the 7-day average of daily new infections recorded in the City dropped to 172 or approximately 19.7 new infections per 100,000 residents (based on an 874,000 population), a decrease of approximately 18 percent from last week. According to DPH, the 7-day average infection rate among vaccinated residents was 18.3 per 100,000 “fully vaccinated” residents and 47.4 per 100,000 unvaccinated residents. It is unclear whether “fully vaccinated” means 2, 3 or 4 doses. The latest report from the New York Times says the 7-day average on August 23 was 176, a 25 percent decrease over the past two weeks. Wastewater monitoring shows covid in the City’s southeast sewers about where it was (or a little higher) than two weeks ago. This report comes from the Stanford model.
As of August 19, Asians have recorded 1,054 infections or 27.8 percent of the month’s total; Whites 820 infections or 21.6 percent; Latinxs 593 or 15.6 percent; Blacks 206 infections or 5.4 percent; Pacific Islanders 26 infections or .7 percent; Multi-racials 26 infections or .7 percent; and Native Americans have recorded 6 infections or .2 percent of the recorded infections so far in August.
On August 16, the 7-day rolling Citywide average positivity rate dropped 10 percent during the past week to 8.7 percent, the lowest positivity rate since May 3. Since last week, the average daily testing dropped approximately 6.4 percent. It is the lowest average daily testing number since July 7, 2021. Between June 20 and August 19 (of this year), the Mission had a positivity rate of 12.5 percent, roughly the same as our last report.
Since August 11, 1,644 San Francisco residents received their first or second shot. Vaccination rates in SF show virtually no change for the past two or three months. 90 percent of all San Franciscans have received one shot, 85 percent two shots and 64 percent have received at least one booster. As of August 22, DPH estimates 63 percent of Mission residents have received at least one booster. Note: Over 90 percent of residents in Bayview Hunters Point have been vaccinated and 66 percent have at least one booster. Less than 50 percent of Lakeshore residents have been vaccinated and 35 percent have received at least one booster.
For information on where to get vaccinated in and around the Mission, visit our Vaccination Page.
Twenty-one new covid-related deaths have been reported since our last report, bringing the total since the beginning of the year to 287. So far, 38 have been recorded in July and 9 in August. Over roughly the same period in 2021 there werer 319 covid-related deaths. The infection fatality rate between January 1 and August 1 is roughly .3 percent (based on recorded infections). DPH won’t say how many were vaccinated. It only provides cumulative information on race, ethnicity or socioeconomic status. According to DPH “COVID-19 deaths are suspected to be associated with COVID-19. This means COVID-19 is listed as a cause of death or significant condition on the death certificate.” Using a phrase like “suspected to be associated with” indicates the difficulty in determining a covid death. The fog gets denser as DPH reports, as it has for months, only 21 of the deaths are known to have had no underlying conditions, or comorbidities. DPH only supplies cumulative demographic numbers on deaths.
The lack of reliable infection numbers makes R Number estimates very uncertain. Covid R Estimation on August 19 estimated the San Francisco R Number at .94 while its estimate for the California R Number on August 22 was .99. The ensemble, on August 21, estimated the San Francisco R Number at .89 and the California R Number at .93. Note: All models in the ensemble show SF below 1.
As of August 19, San Franciscans aged 0-4 have recorded 161 infections in August or 4.2 percent of the month’s total; 5-11 116 infections or 3.1 percent; 12-17 121 infections or 3.2 percent; 18-20 72 infections or 1.9 percent; 21-24 194 infections or 5.1 percent; 25-29 370 infections or 9.7 percent; 30-39 758 infections or 20 percent; 40-49 563 infections or 14.8 percent; 50-59 529 infections or 13.9 percent; 60-69 427 infections or 11.2 percent; 70-79 300 infections or 7.9 percent; and those San Franciscans aged 80 and above recorded 187 infections or 4.9 percent. The proportion of older infected residents (60+) has continued to rise.
Dear CSL3,
When I said “outlier,” I wasn’t trying to be insulting. In Violet Blue’s latest post, she seemed to be a little forlorn that most of the folks around her were not looking at things the same way as she was. As I said, I respect folks who have unpopular views and have often been one of those folks! Unpopular doesn’t mean wrong. Thanks for linking to Violet; she certainly is to be commended on her diligent research in support of her views. There is other scientific research out there, however, and some of it is contradictory to the research she cites. Which is just to say, there is no “the science” in some of these matters. Here are a few alternative takes with links to research which you may or may not be aware of in the same way as I was not aware of Violet and her research:
https://sensiblemed.substack.com/p/the-aap-american-academy-of-pediatrics
https://www.commonsense.news/p/let-djokovic-play?triedSigningIn=true
https://vinayprasadmdmph.substack.com/p/a-checklist-for-covid-policy
Take care.
Everyday the mandates are out-of-place and someone lives in their anti-mask/anti-vax bubble calling it “just like the flu”… those things will extend this pandemic indefinitely.
Stick to the science: https://www.patreon.com/posts/pandemic-roundup-71006498
Get vaxxed. 💉
Get boosted. 💉
Mask up. 😷
Social distance. ↔️
I didn’t read anyone here saying it’s the flu or hating on the vaccines. Can you say what the best plan is going forward and identify an end point? When would be a good time to end mask mandates, school closures, etc along with their negative effects in your estimation? Lots of folks think those should be eased now or, like most of Europe, abandoned entirely. What is your proposed end point; when the costs of these interventions outweigh their benefits in your mind? When does the face shield come off? I don’t think, absent clear and specific goals, that these interventions are sustainable. Is there a counter example somewhere i.e. a country or state where things are being done the way you would like them to be? Is there a place more strict than SF? LA, perhaps? China?
You’re asking the same asinine question that I’ve already answered (https://missionlocal.org/2022/08/8-12-22-tracker/ ), so I’m not repeating myself to an-anonymous-troll-who-repeats-misinfo-when-I-show-receipts. Period.
All I can understand from you is that the pandemic will be over when you and Violet Blue say it’s over and, anyone who has different views only deserves insults. I appreciate and respect you two for having such outlier views and acknowledge that you may be right about one or all of them. And, we may agree on some things. It’s difficult to engage though if you just think everyone who asks a question or two has ill intent and only deserves disrespectful insults. That doesn’t seem to me to be a very effective way to win people over but you would be a better judge of that than me.
You keep saying “outlier views” without a shred of evidence whilst I constantly back up everything I’ve said with scrutinised scientific truths.
Either show and prove, or keep quiet with your super-spreading bullshit. The rest of us are too busy acting like adults and trying the stop the spread.
Stick to the science: https://www.patreon.com/posts/pandemic-roundup-71006498
Get vaxxed. 💉
Get boosted. 💉
Mask up. 😷
Social distance. ↔️
I wish the framing on this issue were not “if you don’t agree with my take on necessary COVID restrictions, you are an uncaring monster who wants people to die.” I think there are very few people who deny that COVID is a serious public health issue OR people who think we should go full lockdown with maximum restrictions forever. We all want this terrible disease to create as little harm as possible and we must try to understand the trade offs on particular actions (or inactions) and make the best decisions possible. Part of that understanding might involve tracking all of these numbers and charts. If these numbers are to be useful, however, they need to be accurate and placed in context. It seems ludicrous, at this point, that the so called “COVID hospitalizations” include people just testing positive for COVID (which, in the age of Omicron, is going to happen A LOT) and happen to be in the hospital for some other reason. I don’t see how reporting those numbers helps us at all if the goal is to have some idea of COVID’s impact on hospital capacity. The other thing that always seems to be missing is the GOAL of any particular restriction and the standard for when that restriction should be ended. For folks who think right now, for example, mandatory masking should be in place, can they say when they would be comfortable stopping that practice i.e., what case numbers or whatever data point is required to end the measure? Again, only very few of us actually think we need 0 cases of COVID before we can have no restrictions so what is the standard then? Lastly, we need to make sure to think about the downsides of actions as well as the upsides. The most glaring example of a COVID measure that has created immeasurably more harm, in my opinion, than it has helped is school closure. Many kids’ lives and their family’s lives have been severely (some knowledgeable experts say catastrophically and permanently) harmed. In the meantime, there have been exactly 0 randomized controlled trials conducted in 3 years to answer the question of how much those closures have been helpful. In Europe, they largely did not close schools for more than a few weeks and they are all pretty happy with how that turned out. I am assuming they love their kids and families as much as we do and just looked at the situation differently. What are the smartest, least harmful things to do in the current situation? That’s the question for all of us to grapple with. Not, “do you want everyone to die, or do you want everyone to be locked away in their rooms forever” which seems to be the way this conversation often gets framed.
Yeah, I’ve been pretty cautious, but at a certain point, unless you are high risk, the cure is worse than the disease. We are social animals. We need to be social. It is lethal to our mental health to isolate. And most folks I know, even those who are masked everywhere, have gotten covid, and they were all FINE. So what’s the point of being super cautious? We did a hardcore shut down and still covid spread. And folks are over it. At this point expecting folks to mask up and social distance is like expecting folks to go vegan – a good idea in practice, but one very few people actually want to do.
I know this is merely related, but what is actually going on with Laguna Honda?
I’ve heard a lot of conflicting things about whether it is closing, moving people out, or working on a new application…
750 beds for elders in need, how can we just lose that without a huge public outcry?
And considering how many San Franciscans could be speaking out from Mark Ghaly, CA Secy of Health, Gavin Newsom, Nancy Pelosi, Xavier Becerra Secy HHS, Kamala Harris, …. why aren’t these folks stepping up?
I think it is very much related. Laguna Honda provides an important public health service to our city.
If Covid-19 is going to continue to be a concern, and maybe Monkeypox, and maybe even Polio (although I can’t imagine, but then again…) , we are going to need Laguna Honda to help care for our community.
We also are facing a wave of Boomers aging. The eldest Boomers are 76 this year, and there are so many of them in the city. 750 beds at Laguna Honda is going to be critical in another 4-5 years, if not right now.