
Good morning, Mission, and welcome to Virus Village, your (somewhat regular) Covid-19 data dump.
As recorded infection numbers and positivity rates rise, hospitalizations remain remarkably flat. R Number models suggest the virus is increasing in the City.
San Francisco’s Department of Public Health continues to promote vaccination and has increased testing in some of the City’s hardest-hit neighborhoods. SFDPH continues to withhold demographic and vaccine data on hospitalizations, and provides no new updates on schools for 2022.
With reports of new variants and sub-variants, the virus seems to be rapidly changing. Here is a partial update.
The reports underscore how little is really understood about the virus, including transmission.
One thing that is known is that, with better ventilation, indoor spaces can be made relatively safer. The technology exists and the costs are not prohibitive. Does that mean companies are investing in improved working conditions?
Is public health un-American? The jury is still out on that question, but one judge has spoken.
Now that mask mandates for public transportation are falling, more expert celebrities are engaging in the questionable practice of individual risk calculation. What do you need to know to make that calculation with respect to masking on flights? A lot.
Haven’t we learned that leaving covid safety measures up to personal choice has perilous downsides? Apparently not, as this recent super-spreader event took place in Washington, D.C., with Anthony Fauci, among others, in attendance.
Here’s a summary of what U.S. officials consider expectations and priorities in the coming weeks.
Meanwhile, China has taken a very opposite approach. We know very little about what is going on these days in China, what their policies are and why they’ve chosen the path they’ve taken. This recent report is from the Global Times, a media source that regularly reflects official Chinese attitudes.
Closer to home, the U.S. Centers for Disease Prevention and Control has announced its new Center for Forecasting and Outbreaks Analytics. Sounds impressive, though there’s no mention of improved data sources, which has been an ongoing issue.
Scroll down for today’s covid numbers.
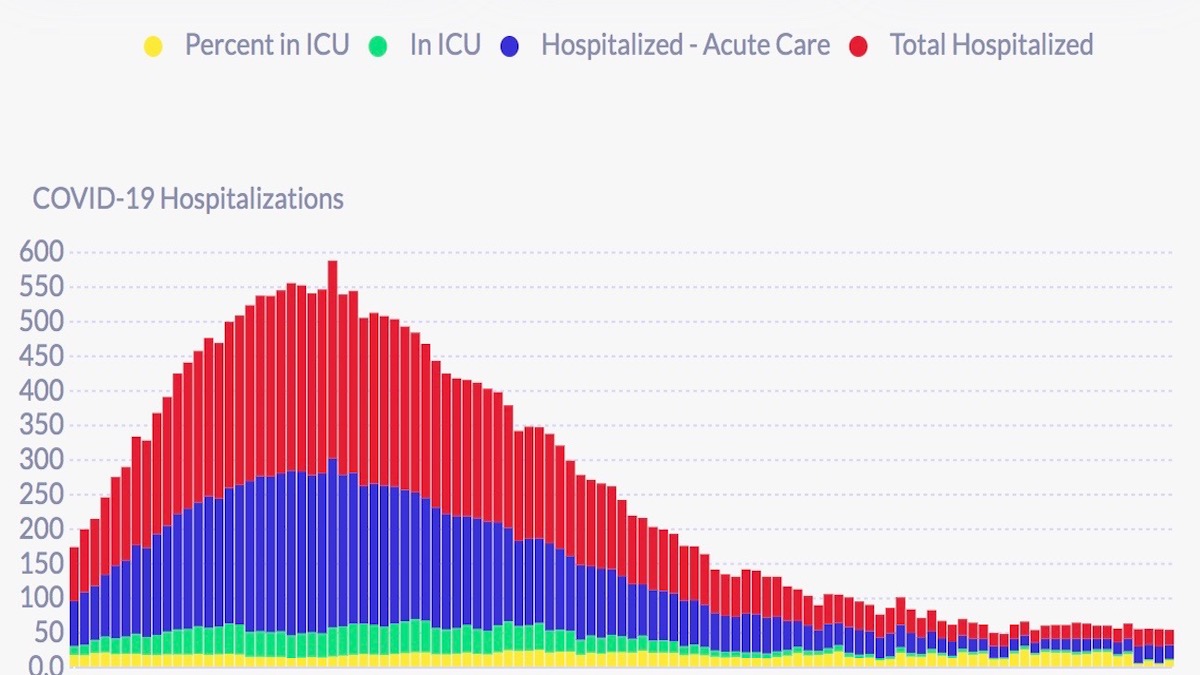
Over the past week, hospitalizations have rose 16 percent (which represents only 3 patients) On April 16, DPH reports there were 22 covid hospitalizations, or about 2.5 covid hospitalizations per 100,000 residents (based on an 874,000 population). Covid patients in ICU has dropped by 2 over the week and the ICU population has been in single digits since March 2. On April 17, the California Department of Public Health reports 28 covid patients in SF hospitals and 2 ICU patients.
The latest report from the federal Department of Health and Human Services shows Zuckerberg San Francisco General Hospital with 4 covid patients and 9 ICU beds available, while across the Mission, CPMC had 2 covid patients and 2 ICU beds available. Note: A physician researcher at SFGH says the hospital has currently only 1 covid patient. Of 36 reported covid patients in the City, 19 were at either SFGH or UCSF, with at least 80 ICU beds available among reporting hospitals (which does not include the Veterans Administration or Laguna Honda). The California DPH currently reports 99 ICU beds available in San Francisco.
Between Feb. 14 and April 15, DPH recorded 425 new infections among Mission residents (a 14 percent drop since last report) or 72 new infections per 10,000 residents. During that period, Mission Bay had the highest rate at 144 new infections per 10,000 residents. Of 38 neighborhoods, 7 had rates above 100 per 10,000 residents, with 4 in the east and southeast sectors of the City. Treasure Island had the lowest rate (uncalculated) with only 5 new reported infections.
DPH reports on April 12, the 7-day average of daily new infections recorded in the City rose to 136 or approximately 15.5 new infections per 100,000 residents (based on an 874,000 population), representing a 14.3 percent rise from last week. According to DPH, the 7-day average infection rate among vaccinated residents was 14.7 per 100,000 “fully vaccinated” residents and 27.5 per 100,000 unvaccinated residents. It is unclear whether “fully vaccinated” means 2, 3 or 4 doses. The latest report from the New York Times says the 7-day average number on April 19 was 154 an 18 percent over the past two weeks. For those interested in wastewater monitoring, see here.
asWe are still working to improve the graph. As of April 15, DPH reports 677 new recorded infections among the City’s White population, or 32.8 percent of April’s recorded infections so far; Asians 546 infections or 26.5 percent; Latinxs 201 infections or 9.7 percent; Blacks 54 infections or 2.6 percent; Multi-racials 10 infections or .5 percent; Pacific Islanders 8 infections or .4 percent; and Native Americans have recorded 2 new infectons or .1 percent of the City’s infections so far in April.
The 7-day rolling average of of Citywide tests rose 5.5 percent over the week. The 7-day rolling Citywide average positivity rate rose almost 9 percent during that time.
As of April 19, DPH reports 784,965 San Franciscans have received at least one vaccine dose (a rise of .6 percent) representing over 90 percent of all San Francisco residents, and 84 percent have now received two. For residents 5 and older, those with one dose remain above 90 percent and those with two rose to 88 percent while for those 65 and older over 90 percent have received two doses. As of April 19, approximately 518,370 SF residents (71 percent of all residents, 86 percent of residents 65 and older) have received a COVID-19 booster dose, an increase of 9 percent over the past week.
For information on where to get vaccinated in and around the Mission, visit our Vaccination Page.
Six new covid-related deaths, 3 more in April, have been reported, bringing the total since the beginning of the year to 163. DPH won’t say how many were vaccinated. Nor does it provide information on the race/ethnicity or socio-economic status of those who have recently died. According to DPH “COVID-19 deaths are suspected to be associated with COVID-19. This means COVID-19 is listed as a cause of death or significant condition on the death certificate.” Using a phrase like “suspected to be associated with” indicates the difficulty in determining a covid death. The fog gets denser as DPH continues to report only 21 of the deaths are known to have had no underlying conditions, or comorbidities.
The lack of data has made R Number estimates very uncertain. Covid R Estimation on April 15 estimated the San Francisco R Number at 1.56 while estimating the California R Number at 1.28 on April 18. The ensemble, as of April 17, estimates the San Francisco R Number at 1.04 while estimating the California R Number at .87. Only one model in the ensemble has SF under 1.
In April so far, those San Franciscans aged 0-4 had 62 recorded infections or 3.0 percent of the monthly total; 5-11 90 infections or 4.4 percent;12-17 47 infections or 2.3 percent; 18-20 39 infections or 1.9 percent; 21-24 161 infections or 7.8 percent; 25-29 293 infections or 14.2 percent; 30-39 575 infections or 27.9 percent; 40-49 314 infections or 15.2 percent; 50-59 205 infections or 9.9 percent; 60-69 125 infections or 6.1 percent; 70-79 93 infections or 4.5 percent; and those San Franciscans 80 and older had 60 recorded infections or 2.9 percent of the month’s total so far.
In recent weeks I heard lots of twitter docs, epis, other pundits alerting us to BA.2 in the UK but especially noting how incredibly steep the rise was and hence we should take that to understand that deaths in the UK were going to skyrocket and so would ours, yikes, yikes, yikes!
And so they were very angry with calls to unmask just when the US was going to be hit hard hard hard hard with BA.2 deaths just like in the UK, wowie, wowie, wowie!
It’s weird they are clearly more educated than me on this, but at the time they were shouting about UK deaths hitting a pole and rising like an impulse function, the UK daily cases had already peaked and was coming down….
And guess what has happened to
1. The UK death rate (which typically lags the case rate by a couple of weeks)?
2. These pundits tweets?
Sigh, twitter ruins everything, but it frequently reveals quite a bit about our uber elite, uber educated class…
Right Jay. Our experts have given up on controlling transmission. It’s part of the “endemic” argument, or “learn to live with it.” Anyway, it’s “too hard” and “too expensive”. It seems as long as hospitals don’t have to change their business model, the whole thing is just one big yawn. Death’s? Remember when covid deaths were the reason for the lockdowns? Now? No big deal, even though with a less virulent variant and widespread vaccination, there were more deaths in 2021 than 2020.
> One thing that is known, is that with better ventilation, indoor spaces can be made relatively safer. The technology exists and the costs are not prohibitive. Does that mean companies are investing in improved working conditions?
SFUSD evidently **removed** ventilation requirements?