
Good morning, Mission, and welcome to Virus Village, your (somewhat regular) Covid-19 data dump.
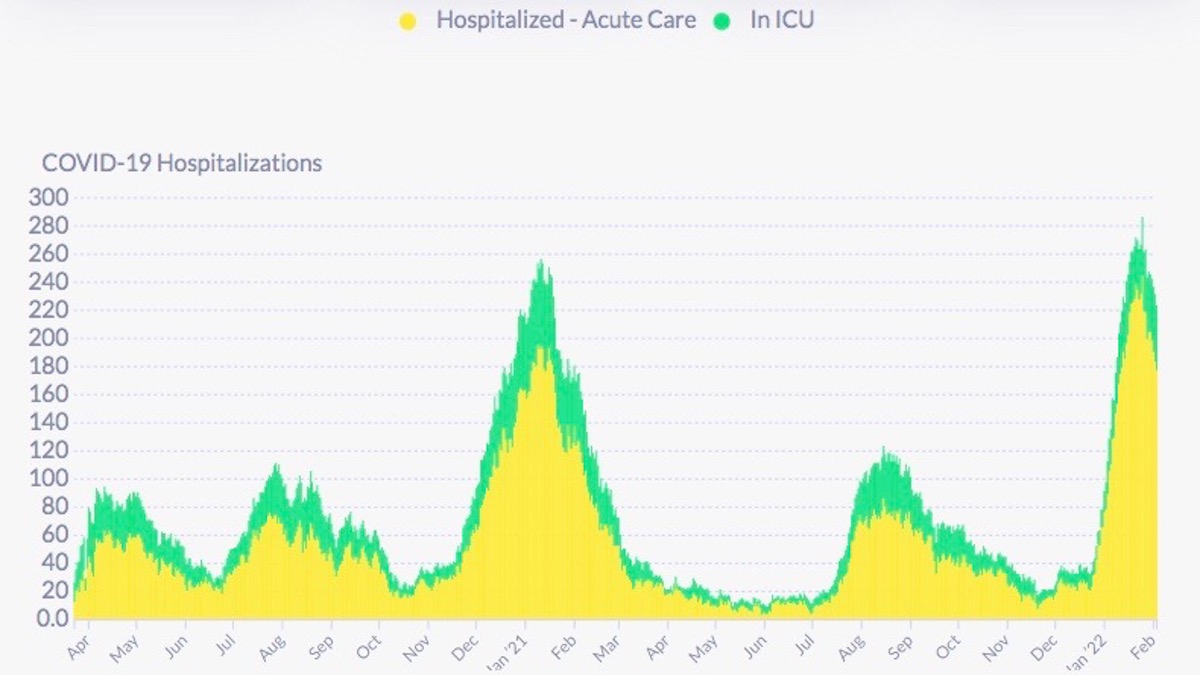
Hospitalizations decline as recorded infections plunge and positivity rates continue slowly downward. R Number models underline the ebbing spread of the virus.
San Francisco’s Department of Public Health was noticeably muted when omicron was surging. Was the minimalist response (mask and vaccine requirements indoors) premeditated? “Omicron has shown us that we can’t prevent every case,” said Dr. Grant Colfax, director of DPH, suggesting to the City’s response as a “test,” which will “guide us to managing a more endemic state.”
Unfortunately, as we know by now, “endemic” is a tricky, highly ambiguous term. I hope Dr. Colfax is not implying the City can now forget about testing, tracing, ventilation, isolation support, hospital capacity and health care equity.
Omicron, like the waves before it, and those that come this year, has shown how socio-economic inequality has been the main driver of the pandemic. It’s not a particularly new insight.
But it could get worse, very soon.
Another favorite pandemic cliche has been taking measures to protect the old and immunocompromised. Without serious changes, that won’t be easy.
Were the un-boosted responsible for the astounding omicron numbers? Some think so, while other think the booster had little effect on infection .
Some data on the effects The Vaccine may have on long term cellular immunity are being reported now, as are new studies with relevancy for the fifth shot now being developed for release before next winter’s surge.
While the booster debate still swirls in the U.S. and other high income countries, most of the world still waits for the first shot. A welcome change may soon be coming, as South African scientists have copied the Moderna vaccine for manufacture (without any help from Big Pharma).
Scroll down for today’s covid numbers.
The U.S. Centers for Disease Control data used for the chart lags behind the data supplied from the San Francisco Department of Public Health. As of Feb. 6, DPH reports 780,497 residents have been vaccinated, more than 89 percent of all San Francisco residents have received one dose, and over 82 percent have received two. For residents 5 and older, DPH reports the figures rise above 90 percent and above 86 percent while for those 65 and older over 90 percent have received two doses. SFDPH reports that as of Feb. 6, approximately 461,230 SF residents (64 percent of all residents) have received a COVID-19 booster dose.
For information on where to get vaccinated in and around the Mission, visit our Vaccination Page.
On Feb. 3, DPH reports there were 223 covid hospitalizations, or about 25.5 hospitalizations per 100,000 residents (based on an 874,000 population). ICU numbers continue to show little change. Today, the California Department of Public Health reports 214 covid patients in SF hospitals and 39 ICU patients.
The latest report from the federal Department of Health and Human Services shows Zuckerberg San Francisco General Hospital with 46 covid patients and 1 ICU bed available, while across the Mission, CPMC had 22 covid patients and 2 ICU beds available. Of 287 reported covid patients, 131 were at either SFGH or UCSF, with at least 54 ICU beds available among reporting hospitals (which does not include the Veterans Administration). The California DPH currently reports 86 ICU beds available in San Francisco. Note: The Government Accountability Office GAO) has issued a scathing report for sustained public health crisis failures at HHS. The failures cited include “collecting and analyzing data to inform decisionmaking.”
Note: DPH uses dated population figures for neighborhoods. Between Dec.4 and Feb. 2, DPH recorded 3905 new infections among Mission residents or 664 new infections per 10,000 residents. Bayview Hunters Point has the highest number of recorded new infections (4343) with a rate of 1145 new infections per 10,000 residents. Of 38 neighborhoods, 17 had rates above 600 per 10,000 residents, 15 in the east and southeast sectors of the City.
DPH no longer reports a glitch in its data systems. This morning the Department says that on Jan. 30, the 7-day average of daily new infections recorded in the City was 659 (down from a peak of 2238 on Jan. 9) or approximately 75.4 new infections per day per 100,000 residents (based on an 874,000 population). According to DPH, the 7-day average infection rate among vaccinated residents on Jan. 26 was 64.9 per 100,000 “fully vaccinated” residents and 172.2 per 100,000 unvaccinated residents. It is unclear whether “fully vaccinated” includes boosters or the infection rate among those vaccinated with 2 doses.
For the month of January, Asians had 11,255 recorded infections or 27.5 percent of the month’s total; Latinxs had 9,669 or 23.7 percent, Whites had 9,301 or 22.8 percent, Blacks 2,797 or 6.8 percent, Multi-racials 574 or 1.4 percent, Pacific Islanders 445 or 1.1 percent, and Native Americans had 106 recorded infections or .3 percent of the month’s total.
For the month of January, Latinx San Franciscans had a positivity rate of 25.9 percent, Pacific Islanders 21.7 percent, Blacks 20.7 percent, Native Americans 18.4 percent, Multi-racials 18.2 percent, and White San Franciscans had a January positivity rate of 12.2 percent.
DPH today reports that of Jan.29, there have been at least 38 covid-related deaths in the City so far in January. What is a covid-19 death, or a “covid-related” death? Last week I expressed frustration at not being able to locate a DPH definition of “covid-19” death. Fortunately, a reader pointed out what I missed. According to DPH “COVID-19 deaths are suspected to be associated with COVID-19. This means COVID-19 is listed as a cause of death or significant condition on the death certificate.” Using a phrase like “suspected to be associated with” indicates the difficulty in determining a covid death. The ambiguity is heightened when currently it is unknown whether or not 34 percent of the deaths had one or more underlying conditions. At this time, only 21 are known to have had no underlying conditions, or comorbidities.
Covid R Estimation lowered its San Francisco R Number estimate again to .72 while lowering its California R Number to .64. The ensemble lowered its average San Francisco R Number to .58 its average California R Number to .65. All models reporting SF numbers today in the ensemble are well below 1.
For the month of January, San Franciscans aged 0-4 recorded 1,982 infections or 4.8 percent of the January totals; those aged 5-11 had 3,069 infections or 7.5 percent, 12-17 2,807 infections or 6.9 percent, 18-20 1,265 infections or 3.1 percent, 21-24 2,862 infections or 7 percent, 25-29 5,029 infections or 12.3 percent, 30-39 8,936 infections or 21.9 percent, 40-49 5,553 infections or 13.6 percent, 50-59 4,445 infections or 10.9 percent, 60-69 2,816 infections 6.9 percent, 70-79 1,314 infections or 3.2 percent, and those 80 and above had 791 infections or 1.9 percent of the month’s total recorded infections.
I really wish you would discuss the time lag between the nytimes tracker and the dph.
Nytimes purports to have daily case numbers, dph is providing case numbers from a week ago!?
Incredible that we are still at an average level of new cases *twice* the earlier peaks (and with at-home testing hiding even higher numbers), but our R-number estimation is at the lowest ever. I’m not sure I’ll ever understand disease modeling…!
Think of it as the slope of the red line. It is the sharpest downslope yet.