
Good morning, Mission, and welcome to Virus Village, your (somewhat regular) Covid-19 data dump.
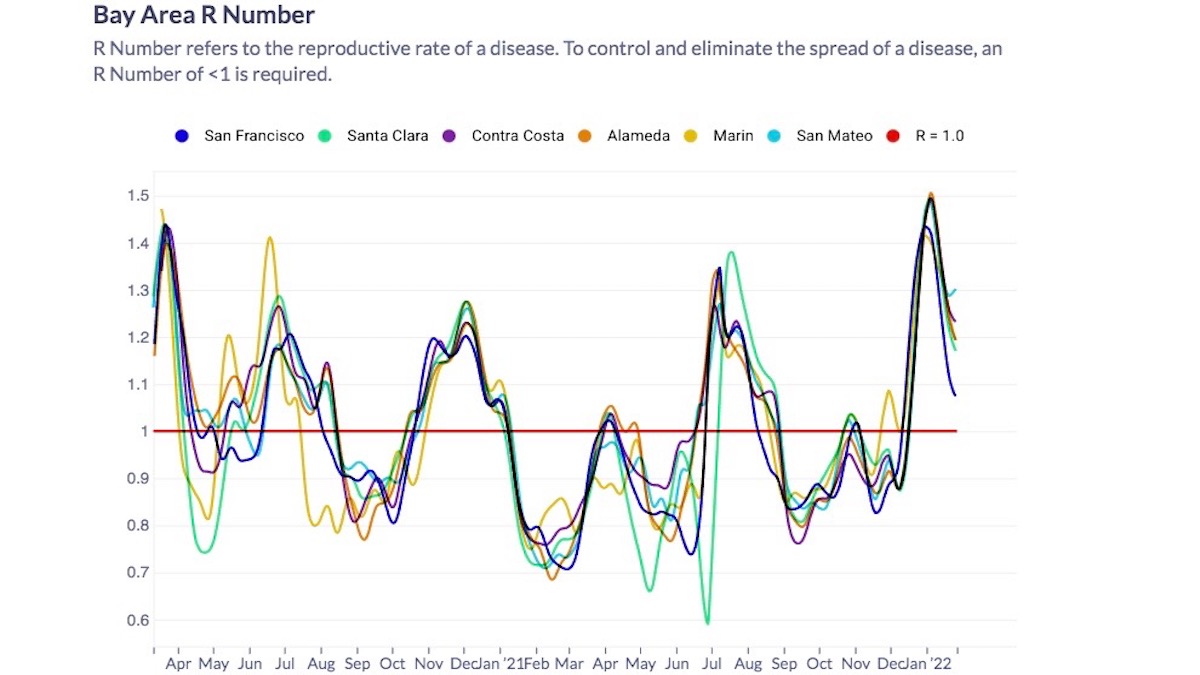
With omicron apparently in decline, R Number models show the San Francisco R Number close to or below 1. Hospitalizations, average infection numbers and positivity rates are coming down. Slowly.
Perhaps in response to low R Number projections, San Francisco’s Department of Public Health announced changes in masking policy and attendance at events such as concerts, ballet and Dubs games. Like most communications from DPH, it may take more than one or two readings to figure out precisely what they’re saying.
The sunnyish changes came after more positive vibes on endemicity from county Health Officer Dr. Susan Philip. A fawning interview from the San Francisco Examiner includes this classic: “Philip has authored a winning formula to keep San Francisco relatively safe … ” (emphasis added).
Neither the San Francisco Department of Public Health nor Dr. Philip has commented on why SF is allowing prominent anti-vaxxer Kyrie Irving to take center stage this weekend at Chase. Minimally, they could have issued a warning that excessive booing may result in a superspreader event.
In contrast to the infrequent, often muddled and rarely informative communications from DPH, check out this communication from the New York City Health Commissioner. When was the last time SFDPH talked to us like adults, or provided a scintilla of demographic data on hospitalizations? Hint: Never.
OK, OK. It could be worse. We could be living in Florida, where the newly nominated Surgeon General can’t say whether The Vaccine is safe and effective.
Not that the virus much cares. A new “stealth” variant of omicron has been found and it’s said to be more contagious than the omicron we now know, Not to worry, says one vaccine researcher who also debunks concern over “Neo-CoV”, a “new variant” which is neither new nor a variant.
And though omicron has the upper hand, delta has not disappeared.
With every surge, we read of hospitals getting “overwhelmed” due to lack of staff, space and protective equipment. Unlike Trump, who gave more than $10 billion earmarked for hospitals to our favorite drug dealers, Biden has diverted only $7 billion.
As officials and experts proclaim the “pandemic” giving way to “endemic,” unlike Dr. Philip above, they often sloganize on the need for “focused protection for the elderly and immunocompromised” without saying what that means. Let’s hope it’s not the Hunger Games.
A brief followup on the decision of the Israel Health Ministry to authorize a fourth shot after initially finding a fourth shot provided little or no added protection. According to an earlier NPR report, the vaccine agreement between Israel and Pfizer “allows Pfizer or Israel to ‘provide input, make factual corrections’ and delay publication of their studies of the vaccine’s effectiveness …” Neither Israel nor Pfizer responded to questions at the time, and I have yet to see any contradict the NPR report. I would appreciate learning of any updates.
Finally, please be aware that neither the U.S. Centers for Disease Control, Food and Drug Administration nor the DPH has confirmed or denied that NoodleMania can prevent covid infections.
Scroll down for today’s covid numbers.
The U.S. Centers for Disease Control data used for the chart lags behind the data supplied from the San Francisco Department of Public Health. As of Jan. 27, DPH reports 778,362 residents, more than 89 percent of all San Francisco residents have received one dose, and over 82 percent have received two. For residents 5 and older, DPH reports the figures rise above 90 percent and above 86 percent while for those 65 and older over 90 percent have received two doses. SFDPH reports that as of Jan. 27, approximately 453,340 SF residents (63 percent of all residents) have received a COVID-19 booster dose.
For information on where to get vaccinated in and around the Mission, visit our Vaccination Page.
On Jan. 24, DPH reports there were 266 covid hospitalizations, or about 30.7 hospitalizations per 100,000 residents (based on an 874,000 population). Hospitalizations have been above 260 since Jan.18, hitting a high of 271 on Jan. 21. Today, the California Department of Public Health has a bit grimmer report: 278 covid patients in SF hospitals with 45 in ICU.
The latest report from the federal Department of Health and Human Services shows Zuckerberg San Francisco General Hospital with 48 covid patients and 6 ICU beds available, while across the Mission, CPMC had 22 covid patients and 4 ICU beds available. Of 264 reported covid patients, 125 were at either SFGH or UCSF, with at least 67 ICU beds available among reporting hospitals (which does not include the Veterans Administration). The California DPH currently reports 58 ICU beds available in San Francisco.
Note: DPH uses dated population figures for neighborhoods. Between Nov. 24 and Jan. 22, DPH recorded 3555 infections among Mission residents or 605 infections per 10,000 residents. Despite over 90 percent of its residents having received at least 2 doses of The Vaccine, Bayview Hunters Point has the highest number of recorded infections (3950) with an incredible rate 1042 infections per 10,000 residents. In contrast, Lakeshore, the only neighborhood in the city with less than 50 percent vaccinated had 525 cases and the third lowest rate in the city at 355 per 10,000 residents. DPH provides no information on neighborhood hospitalizations.
On Jan. 20, the 7-day average of daily new infections recorded in the City was 1284 or approximately 146.8 new infections per day per 100,000 residents (based on an 874,000 population). According to DPH, the 7-day average infection rate among vaccinated residents on Jan. 18 was 127.7 per 100,000 vaccinated residents and for unvaccinated residents, 323.1 per 100,000 unvaccinated residents.
As of Jan. 16, DPH reports 7,240 infections among Asian San Franciscans, or approximately 27.8 percent of all January recorded infections, Latinxs 6,622 infections or 25.4 percent, Whites 6,123infections or 23.5 percent, Blacks 1,862 infections or 7.1 percent, Multi-racials 425 infections, or 1.6 percent, Pacific Islanders 285infections or 1.1 percent and Native Americans recorded 74 infections or .3 percent of all January infections so far.
Between Nov. 24 and Jan. 22, DPH reports 32,740 tests taken by Mission residents or a rate of 557 tests per 1000 residents. The highest number of tests were collected among Sunset/Parkside residents (42,304) and the highest testing rate was among Mission Bay residents (910 per 1000 residents). Bayview Hunters Point had a rate of 760 per 1000 residents and Lakeshore had a rate of 413 per 1000 residents.
Nine new covid-related deaths have been reported. We know nothing about the age, gender, race, etnicity or socio-economic status of those deaths. Nor does DPH report on deaths and underlying conditions by month. Of 715 covid-related deaths, 21 were reported with no underlying conditions, with 450 reported with one or more. The rest are unknown.
Covid R Estimation has slightly raised its San Francisco R Number estimate to 1.07 while lowering its California R Number to 1.16. Still surprisingly low, the ensemble raised its average San Francisco R Number to .72 and California R Number to .69. Three models in the ensemble show SF under 1 with a fourth at 1.01.
As of Jan. 23, DPH reports 75 infections so far in January in Nursing homes (“skilled nursing facilities”) and so far 5 January covid-related deaths. There have been 568 reported infections so far this month in Single Room Occupancy hotels (SROs) and 2 reported covid related deaths
For an alternative take on current SF case numbers… since 14 January, SFMTA has been publishing near daily updates on the routes likely to experience extended wait times due to staffing issues. The two highest days were yesterday (32 routes) and today (17 routes). That accounts for more than a third of the total number of routes delayed over the past two weeks (124 routes).
Thanks for the great work, Mark.
And thanks for mentioning the elderly and immunocompromised.
BTW, I hardly ever see local Covid stories that talk about these folks. There’s the occasional national piece, like the one posted below. But locally, it seems far more skewed towards rosy talk about Covid becoming eugenic, er, endemic.
Please, local journalists, it would be so great to hear more about how immunocompromised/elderly people are doing here in SF.
“There is a casual acceptance that the pandemic will turn into something endemic, an inevitability that everyone will get COVID… with zero acknowledgement that people will still die & deaths will be disproportionately from high-risk groups.” –Alice Wong, disability activist
https://kqed.org/news/11902253
“recently reconstituted San Francisco Examiner ” it was a shriveled husk and now what is it?
Given what a lousy Department of Public Health we have, I”m baffled as to why you
use SFDPH case counts and stats that are a week old. The New York Times provides real time updates current to the day before. So that we know that even though cases are down 39%, yesterday, 1/27, there was a huge jump in new cases to 2568, and they state that because the test positivity rate is 18%, it suggests “cases are being significantly undercounted.”
And hospitalizations are still up 134% from 2 weeks ago as of yesterday.
Again, per NYT, SF current total Covid infections:118,446 and 1 in 7 San Franciscans have been infected.
To add to Mark’s excellent reply… one of the issues with the NYT data which you can see visually in their charts is that they have huge spikes every Monday (from weekend reporting) and every Thursday (it’s unclear why, but predates the Omicron surge). That makes it less suitable for tracking day-to-day changes. Test positivity is indeed still high, and lots of cases are being missed through lack of PCR testing at all (at home tests don’t count anywhere), but that data is somewhat skewed because tests more likely to be positive (symptomatic cases) are processed first by the labs, and the positivity rate drops as more negative test results are added for a given sample date.
Thanks Maria. The reason we use SFDPH numbers is because no covid numbers (especially infection numbers) are absolute, none are precise, all are relative approximations. Different sources give always give different numbers, more or less. And sometimes it’s useful to check other sources, but mostly they tell the same general story. The seven day average infection numbers SFDPH provides account for delays between tests, analysis, reporting, and are meant to show trends. The main reason we continue to use DPH as the primary source is that this is a public agency, therefore at least theoretically, accountable to the public. It took over 9 months of community pressure (and some community-minded UCSF docs) to make DPH respond to the epicenter of the covid crisis in the Mission, Bayview etc. Only then did they begin to “partner” with the LTF, who originally they gave the back of their hand, to provide testing, isolation support and vaccination to those most vulnerable and those most affected. That DPH still gets away with patting themselves on the back for lousy hospitallization data, no contact tracing info, no outbreak data, etc. etc. is a testimony to our unwillingness to demand otherwise. In my opinion, this is the main reason DPH, like DPW, and DBI have been allowed to wither as regulatory agencies as the City, behind all the chatter of “progressivism,” executed the political project of Reagan, Thatcher and Feinstein, by “contracting out” public services to private (for profit and nonprofit) companies. Until we demand accountablity from our “public servants”, that they do the job we pay them to do, they will continue to thow around the same garbage (which they steadfastly refuse to pick up).