
Good morning, Mission, and welcome to Virus Village, your (somewhat regular) Covid-19 data dump.
Since Friday, the average daily case number count recorded by DPH rose another 17 percent, while hospitalizations, a lagging indicator, remained flat. R Number models continue to show local transmission increasing.
While we have probably entered the winter surge, the relatively high vaccination rate in the City and the universal availabillity of the booster suggest this wave may differ from earlier ones. Here’s a fairly good summary Q and A on the booster.
Over the past 20 months, we’ve been inundated with studies relying on various computer models. Are there alternatives? One writer thinks, even though the SARS-CoV-2 is a “novel” virus, it might be more useful to look at available historical data on infectious disease pandemics.
In addition to the vaccine and booster, two new treatment pills may be widely available in the next two months. What do we know so far about those pills?
Moderna’s shot has been linked recently to increased chances of an inflammatory heart condition in young men called myocarditis. In Europe, some countries have discontinued using it for adolescents, amid calls for further study.
It wasn’t enough that Moderna got $10 billion and a guaranteed market from the federal government. Scientists from the National Institutes for Health also contributed substantially to its development. No matter, says Moderna, which continues to claim exclusive patent rights so it can prevent the global production of its vaccine.
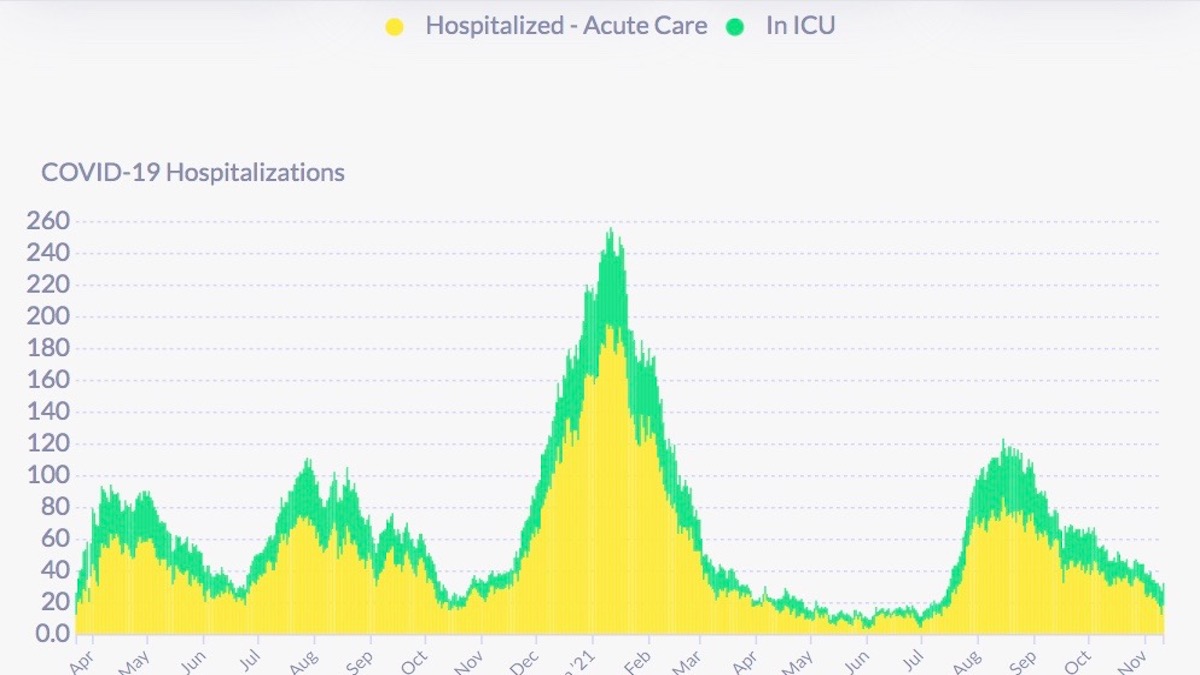
Scroll down for today’s covid numbers.
The U.S. Centers for Disease Control data used for the chart lags behind the data supplied from the San Francisco Department of Public Health. As of Nov. 14, DPH reports more than 83 percent of all San Francisco residents have received one dose, and 76 percent have received two. Oddly, for residents 5 and older, DPH reports the figures rise to 87 percent and 80 percent. Does anyone else have trouble with those numbers? On Nov. 14, the seven-day rolling average of newly vaccinated (one dose) residents was 1,527. Of 118,000 SF seniors eligible for boosters, as of Nov. 1, only 23,000 have received it. Another 52,000 boosters were given to those under 65 who are at greater risk of hospitalization. For information on where to get vaccinated in and around the Mission, visit our Vaccination Page.
On Nov. 11, DPH reports there were 32 covid hospitalizations, or about 3.7 per 100,000 (based on an 874,000 population). There are no new updates on hospitalizations among fully vaxxed residents. According to the latest from DPH, in the month of September the hospitalization rate for unvaxxed residents was 64.8 per 1000 cases while for vaxxed residents it was 20 per 1000 cases. The picture when age is factored in provides a more nuanced view. Fully vaxxed seniors (over 60) have higher rates of hospitalization than younger unvaxxed residents. DPH says its data comes from hospitalizations caused by covid, not another medical condition. According to the CDC, for the week ending Nov. 12, there were 13 new admissions to SF hospitals (-55.17 percent from the prior week). During that week, covid patients accounted for 1.71 percent of SF hospital beds (no change from the prior week) and 4.91 percent of the ICU capacity (no change).
The latest report from the federal Department of Health and Human Services shows Zuckerberg San Francisco General Hospital with 7 covid patients and 9 ICU beds available, while across the Mission, CPMC had 6 covid patients and 3 ICU beds available. Of 50 reported covid patients, 27 were at either SFGH or UCSF, with at least 74 ICU beds available among reporting hospitals (which does not include the Veterans Administration). The California DPH currently reports 74 ICU beds available in San Francisco. SFDPH won’t say.
Note: DPH uses dated population figures for neighborhoods. Between Sept. 11 and Nov. 10, DPH recorded 282 cases in the Mission or a rate of 48 per 10,000 residents. During that period, although Bayview Hunters Point had the most cases (257), Chinatown had the highest rate, 78 per 10,000 residents. Of 38 neighborhoods, 25 had rates lower than 50 per 10,000 residents.
On Nov. 7, the 7-day average of daily new cases in the City was 80, or approximately 9.2 new cases per day per 100,000 residents (based on an 874,000 population). The 7-day average case rate among vaccinated residents was 8.6 per 100,000 fully vaccinated residents and for unvaccinated residents 12.9 per unvaccinated 100,000 residents.
DPH uses dated population figures for racial and ethnic groups. As of Oct. 31, White San Franciscans recorded 707 cases or 40.4 percent of all October cases, Latinxs 310 or 17.7 percent, Asians 369 or 21.1 percent, Blacks 106 or 6.1 percent, Multi-racials 46 or 2.6 percent, Pacific Islanders 16 or .9 percent and Native Americans recorded 4 cases in October or .2 percent of the month’s total.
The Citywide average posititivity rate has reached its highest level since Oct. 11. For the month of October, Native Americans recorded a positivity rate of 3.7 percent, Pacific Islanders 2.4 percent, Latinxs 1.8 percent, Multi-racials 1.6 percent, Whites 1.6 percent, Blacks 1.3 percent and Asians 1.2 percent.
DPH has reported San Francisco’s first November covid-related death, bringing the Delta total (August through November) to 91 and the cumulative covid-related death toll to 668. Last spring’s surge resulted in approximately 90 covid-related deaths recorded between August and October. As of Sept. 30, DPH reports 16 covid-related deaths among “fully vaccinated” residents.
R Number estimates from Covid R Estimation have been fluctuating a great deal recently. This model’s current estimate for San Francisco is a disturbing 1.23. For the California R Number, the estimate is .93. The ensemble raised its average for the San Francisco R Number to 1.09. All but one model in the ensemble currently show the City over 1. The average California’s R Number has been raised to .92.
In October, San Franciscans aged 0-4 recorded 2.7 percent of October cases (down from 3.6 percent in September), 5-11 7.9 percent (up from 6.9 percent), 12-17 2.6 percent (up from 2.5 percent), 18-20 1.1 percent (down from 2.2 percent), 21-24 4.7 percent (down from 8.3 percent), 25-29 14.5 percent (down from 15.7 percent), 30-39 25.5 percent (up from 23.5 percent), 40-49 13.6 percent (up from 13.3 percent), 50-59 11.9 percent (up from 10.4 percent), 60-69 8.4 percent (up from 7.6 percent), 70-79 4.4 percent (up from 3.8 percent), and 80+ had 2.7 percent of October cases, up from 2.3 percent in September.
RE: “Oddly, for residents 5 and older, DPH reports the figures rise to 87 percent and 80 percent. Does anyone else have trouble with those numbers?”
The number of residents 5 and older is less than total population. Smaller denominator -> larger percentage. Consider if 100% of residents 5 and older is vaccinated, the % of total population vaccinated will be less than 100. Maybe I’m missing your point?
I do have trouble though with SFDPH “Total residents vaccinated” number at 723863 vs “Total residents vaccinated 5+” number at 712240. Taken at face value, that means 723863 – 712240 = 11623 residents vaccinated who are NOT 5+. I have no idea what this really means.
CDC Community Profile Report has 752325 people in SF / 85.3% of total population with at least 1 dose, and 665154 people in SF / 75.5% of total population fully vaccinated. As the article notes, CDC data lags SFDPH. CDC doesn’t count fully vaccinated until 2 weeks after 2nd dose of Pfizer/Moderna or dose of J&J but the fully vaccinated 75.5% number is close to SFDPH 76%. Interesting though that CDC shows higher 85.3% for people with at least 1 dose vs SFDPH 83%. Don’t know reason for that.
SF has 75% to 76% of total population fully vaccinated. Recent news note Belgium has 74% of total population fully vaccinated. SF cases just went up ~50% from 7 day average of around 6 per day per 100,000 a week ago to around 9 per day per 100,000 in latest number. Belgium latest 7 day average is just shy of 100 per day per 100,000 which is more than double the SF peak of 42 per day per 100,000 in last year’s winter surge when there was very little vaccination. I get that high vaccination rate is expected to keep hospitalization rate down to below last year’s winter surge. But still, if cases get that high, it could get gnarly.