
Good morning, Mission, and welcome to Virus Village, your (somewhat regular) Covid-19 data dump.
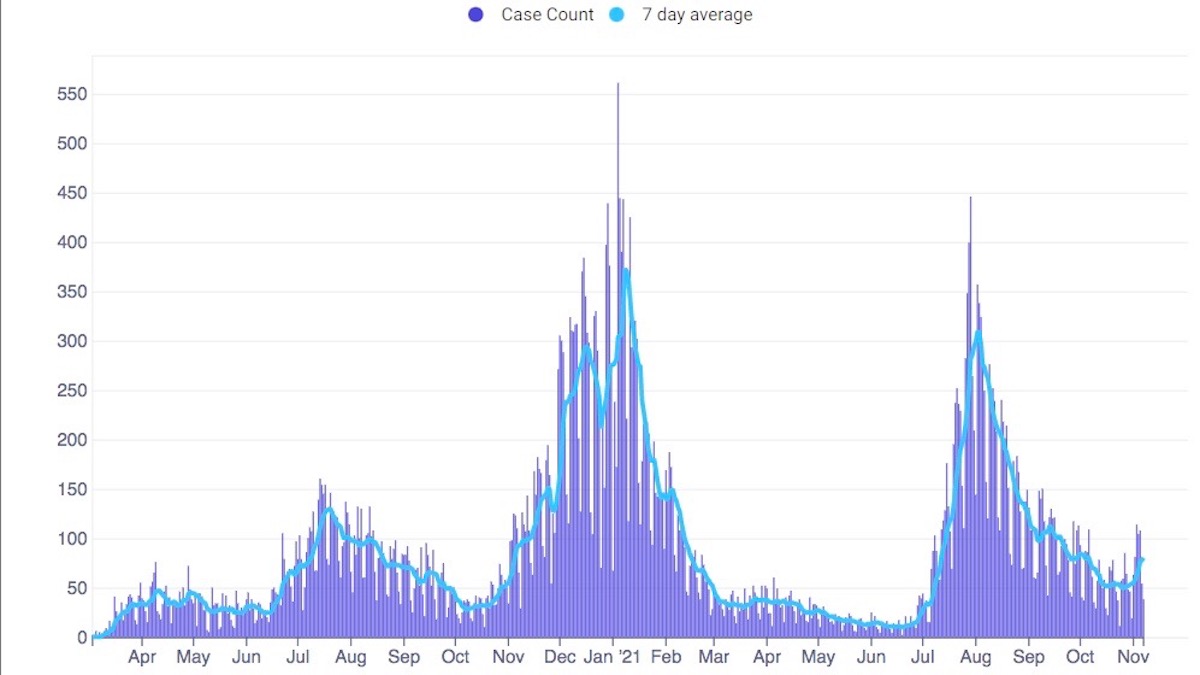
Average case numbers jumped more than 25 percent this week. Hospitalizations, a lagging indicator, continue a downward trend, while the City’s positivity rate remains somewhat stable, below 2 percent. R Number models continue flashing the red light with most showing the City’s transmission rate over 1.
As case numbers declined from the Delta surge, many began discounting case numbers as a useful indicator, arguing that with vaccination, many of the cases were asymptomatic or mild. Of course, this has been true since the pandemic began. Many of the early aggregate numbers were heavily influenced by older and immunocompromised residents who were, and still are, more vulnerable to infection and severe disease than other population groups.
UCSF doc Monica Gandhi has long argued that, instead of case numbers and positivity rates, we should consider using hospitalizations as the key metric.
Unfortunately, the data on hospitalizations, as readers of this column well know, is opaque at best.
What does it mean that hospitalizations are “decoupled” from cases? As seen in Colorado and heavily vaccinated New Mexico, hospitals are once again on the brink of overflowing. We realize now that it doesn’t take all that much to cripple hospitals in many areas (primarily hospitals that serve the income-compromised and the uninsured).
One of the reasons for boosters, which are now available to all adults in California and soon to be available to all adults in the country, is that the antibodies they create protect against infection. Waning antibodies mean less protection against infection, but not less protection against severe disease or hospitalization.
The data on hospitalizatons is not as opaque as the “data” on prisons and jails. Bureaucrats in San Francisco’s Department of Public Health don’t seem to realize that hiding data fuels distrust.
Yes, I know Donald the Dingbat yelled about keeping schools open in 2020, which, at the time, was considered a good reason to keep them closed. Though the elderly and the immunocompromised are the most vulnerable, we now know closed schools resulted in many kids (especially low income and racial minorities) paying a heavy price.
Gandhi’s comrade at the University of California, San Francisco, Bob Wachter, believes that despite seasonal waves and occasional outbreaks, with The Vaccine, and The Pill (soon to arrive), we should be get on with our lives. Many others agree we should be looking for mitigation measure off-ramps.
Want some good news? Cases, hospitalizations and deaths are on a downhill roll in cold and open England. And a Delta outbreak in Ontario showed the power of The Vaccine (without a boost) to reduce transmission.
Scroll down for today’s covid numbers.
The U.S. Centers for Disease Control data used for the chart lags behind the data supplied from the San Francisco Department of Public Health. As of Nov. 11, DPH reports more than 82 percent of all San Francisco residents have received one dose, and 76 percent have received two. Better than 90 percent of those over 65 have received two doses. On Nov. 11, the seven-day rolling average of newly vaccinated (one dose) residents was 1,425, a substantial increase. Of 118,000 SF seniors eligible for boosters, as of Nov. 1, only 23,000 have received it. Another 52,000 boosters were given to those under 65 who are at greater risk of hospitalization. For information on where to get vaccinated in and around the Mission, visit our Vaccination Page.
On Nov. 8, DPH reports there were 32 covid hospitalizations, or about 3,7 per 100,000 (based on an 874,000 population). According to the latest from DPH, in the month of September the hospitalization rate for unvaxxed residents was 64.8 per 1000 cases while for vaxxed residents it was 20 per 1000 cases. The picture when age is factored in provides a more nuanced view. Fully vaxxed seniors (over 60) have higher rates of hospitalization than younger unvaxxed residents. DPH says its data comes from hospitalizations caused by covid, not another medical condition. According to the CDC, for the week ending Nov. 8, there were 18 new admissions to SF hospitals (-43.75 percent from the prior week). During that week, covid patients accounted for 1.95 percent of SF hospital beds (no change from the prior week) and 4.77 percent of the ICU capacity (+.57 percent increase).
The latest report from the federal Department of Health and Human Services shows Zuckerberg San Francisco General Hospital with 7 covid patients and 9 ICU beds available, while across the Mission, CPMC had 6 covid patients and 3 ICU beds available. Of 50 reported covid patients, 27 were at either SFGH or UCSF, with at least 74 ICU beds available among reporting hospitals (which does not include the Veterans Administration). The California DPH currently reports 58 ICU beds available in San Francisco. SFDPH won’t say.
Note: DPH uses dated population figures for neighborhoods. Between Sept. 8 and Nov. 7, DPH recorded 297 cases in the Mission or a rate of 51 per 10,000 residents. During that period, although Bayview Hunters Point had the most cases (275), Chinatown had the highest rate, 85 per 10,000 residents. By case rates and positivity rates, Chinatown seems to be doing substantially worse during the Delta surge than at any time during 2020.
On Nov. 4, the 7-day average of daily new cases in the City was 68, or approximately 7.8 new cases per day per 100,000 residents (based on an 874,000 population). The 7-day average case rate among vaccinated residents was 6.9 per 100,000 fully vaccinated residents and for unvaccinated residents 12.2 per unvaccinated 100,000 residents.
DPH uses dated population figures for racial and ethnic groups. As of Oct. 31, White San Franciscans recorded 702 cases or 40.3 percent of all October cases, Latinxs 309 or 17.7 percent, Asians 365 or 21 percent, Blacks 106 or 6.1 percent, Multi-racials 46 or 2.6 percent, Pacific Islanders 16 or .9 percent and Native Americans recorded 4 cases in October or .2 percent of the month’s total.
For the month of October, Native Americans recorded a positivity rate of 3.7 percent, Pacific Islanders 2.4 percent, Latinxs 1.8 percent, Multi-racials 1.6 percent, Whites 1.6 percent, Blacks 1.3 percent and Asians 1.2 percent.
DPH has reported San Francisco’s first November covid-related death, bringing the Delta total (August through November) to 91 and the cumulative covid-related death toll to 668. Last spring’s surge resulted in approximately 90 covid-related deaths recorded between August and October. As of Sept. 30, DPH reports 16 covid-related deaths among “fully vaccinated” residents.
After estimating SF over 1 for the past two weeks, Covid R Estimation lowered its San Francisco R Number to .89 and raised its estimate for the California R Number to 1.05. The ensemble revised its average for the San Francisco R Number to 1.05, now showing SF over 1 since Oct. 27. All but one model in the ensemble currently show the City over 1. The average California’s R Number has been lowered to .87.
In October, San Franciscans aged 0-4 recorded 2.7 percent of October cases (down from 3.6 percent in September), 5-11 7.9 percent (up from 6.9 percent), 12-17 2.6 percent (up from 2.5 percent), 18-20 1.1 percent (down from 2.2 percent), 21-24 4.7 percent (down from 8.3 percent), 25-29 14.5 percent (down from 15.7 percent), 30-39 25.5 percent (up from 23.5 percent), 40-49 13.6 percent (up from 13.3 percent), 50-59 11.9 percent (up from 10.4 percent), 60-69 8.4 percent (up from 7.6 percent), 70-79 4.4 percent (up from 3.8 percent), and 80+ had 2.7 percent of October cases, up from 2.3 percent in September.
Please don’t post links to the Financial Times. It’s behind a paywall.
Didn’t Monica Gandhi said the same thing right before the delta surge and the actual data proved her otherwise? Maybe hospitalization & death didn’t rise as much as previous waves during the delta surge, but there is still long way to go before cases & hospitalization decouples.
Yes she did. It’s not clear what “decouples” means and an infection hospitalization rate can’t be known as DPH does not report cumulative hospitalizations or new admissions. It does appear there were fewer hospitalizations this summer than last, but deaths seemed to have been about the same.