
Good morning, Mission, and welcome to Virus Village, your (somewhat regular) Covid-19 data dump.
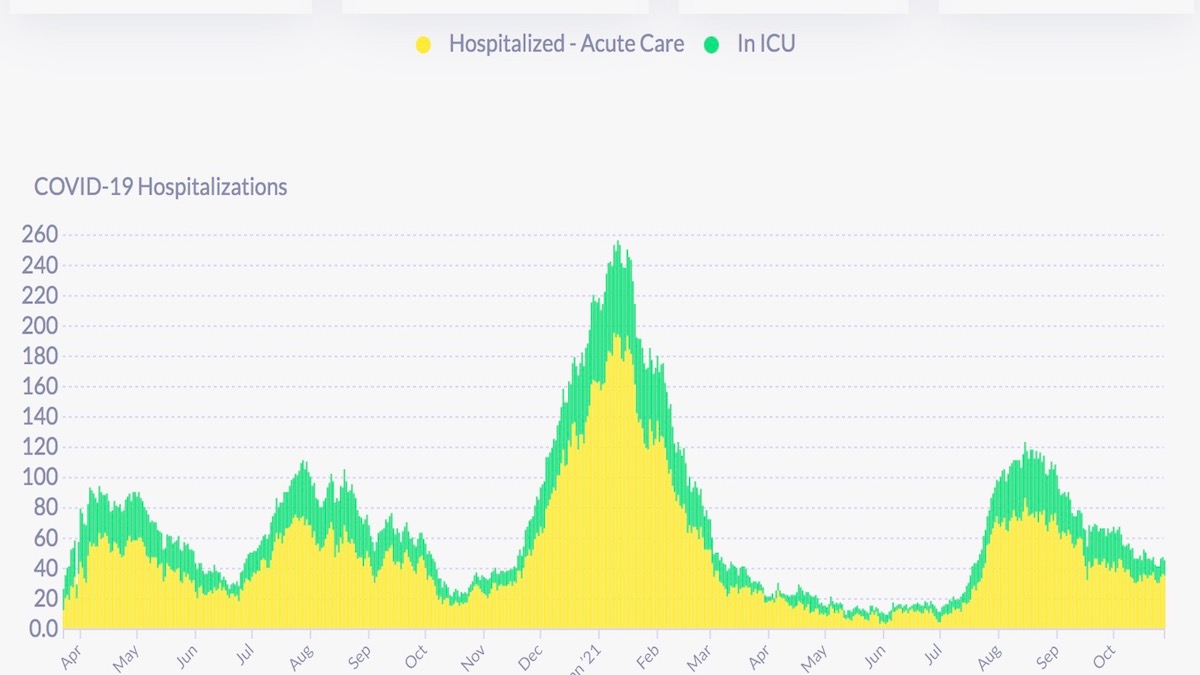
Case numbers, hospitalizations and positivity rates all seem more or less stuck on the current plateau. Hospitalizations have been fluctuating in the 40s and low 50s for most of October, while case numbers have hung in the low 50s for the past couple weeks. Positivity rates remain relatively low and the R Number remains below 1.
“Observational studies” suggest Grim Reaper costumes were less prevalent this year than in the past. Is this evidence of The Vaccine’s efficacy in the real world? While waiting to see what happens over the holidays, more experts weigh in on the potential covid “endgame.”
Need a new covid controversy to get your blood boiling this Monday morning? How about vaccine mandates for kids? Buckle up. It may not be “masking”, but battle lines have already been drawn.
Let’s not forget booster mandates. Here is more evidence from Israel on the efficacy of the third shot.
With the FDA approval of The Vaccine for kids 5 to 11, are you surprised that questions are coming up? Like whether weight matters.
Recent data from the U.S. Centers for Disease Control confirms what we already knew, even though the San Francisco Department of Public Health refuses to provide us with the numbers: most hospitalizations are among those 65 and older, and rates for those 17 and younger are very low.
Correction: DPH does, more or less, provide current data on the impact of covid on kids and schools. See below.
Scroll down for today’s covid numbers.
The U.S. Centers for Disease Control data used for the chart lags behind the data supplied from the San Francisco Department of Public Health. As of Oct. 31, DPH reports more than 81 percent of all San Francisco residents have received one dose, and 76 percent are completely vaccinated. Better than 90 percent of those over 65 are fully vaccinated. On Oct. 31, the seven-day rolling average of shots per day rose to 324 (we don’t know how many were boosters).For information on where to get vaccinated in and around the Mission, visit our Vaccination Page.
On Oct. 28, DPH reports there were 45 covid hospitalizations, or about 5.1 per 100,000 (based on an 874,000 population). DPH has not reported breakthrough hospitalizations and deaths since Sept. 17 in order “to conduct a thorough review of data quality and completeness.” According to the CDC, there were 31 new admissions for the seven days ending Oct. 26 (-18.42 percent from the previous seven days). For the week ending Oct. 26, covid patients accounted for 2.34 percent of hospital beds (no change from the previous week) and 4.23 percent of ICU beds (-.78 percent from the previous week). As of Oct. 18, the CDC says that, of more than 189 million vaccinated U.S. residents, 41,127 patients with a covid vaccine breakthrough infection were hospitalized or died (though 26 percent were either aymptomatic or not covid related). Note: 85 percent of the deaths and 66 percent of the non-fatal hospitalizations were among those 65 and older.
Since the beginning of the pandemic, roughly 50 percent of SF covid hospitalizations have been treated in only two hospitals. Why? The latest report from the federal Department of Health and Human Services shows Zuckerberg San Francisco General Hospital with 7 covid patients and 6 ICU beds available, while across the Mission, CPMC had 4 covid patients and 3 ICU beds available. Of 54 reported covid patients, 29 were at either SFGH or UCSF, with at least 75 ICU beds available among reporting hospitals. The California DPH currently reports 69 ICU beds available in San Francisco. SFDPH won’t say.
Note: DPH uses dated population figures for neighborhoods. Between Aug. 28 and Oct. 27, DPH recorded 291 cases in the Mission or a rate of 50 per 10,000 residents. During that period, although Bayview Hunters Point had the most cases (332), Chinatown had the highest rate, 89 per 10,000 residents. Rates of 50 per 10,000 or above were recorded in 21 neighborhoods.
On October 24, the 7-day average of daily new cases in the City was 51, or approximately 5.8 new cases per day per 100,000 residents (based on an 874,000 population). The 7-day average case rate among vaccinated residents was 4.8 per 100,000 fully vaccinated residents and for unvaccinated residents 10.6 per unvaccinated 100,000 residents.
Though DPH uses dated population figures for racial and ethnic groups, the numbers give a fairly good picture of what has transpired so far during the pandemic. The cumulative case rate for Latinx residents based on the group’s population figures is 1,359 per 10,000 residents, Blacks 928, Whites 392, and Asians 317 per 10,000 residents. Because of their relatively low total populations, rates for Pacific Islanders 2,260 and Native Americans 1,034 per 10,000 residents are considered “unreliable.”
As of Oct. 24, DPH estimates the October positivity rate for Native Americans is 4.2 percent, Pacific Islanders 2.1 percent, Latinxs 1.7 percent, Multi-racials 1.6 percent, Whites 1.5 percent, Blacks 1.4 percent and Asians 1.2 percent.
Another October death has been attributed to covid, bringing the Delta total so far (August to October) to 85 and the cumulative covid-related death toll to 662. September and October numbers should be considered “less reliable” meaning updates are likely. Last spring’s surge resulted in approximately 90 covid-related deaths recorded between August and October. For over a month, DPH has not reported on vaccination status and covid-related death.
Covid R Estimation kept its San Francisco R Number at .98 and lowered its estimate for the California R number .97. The ensemble suggests much lower transmission. The current average for the San Francisco R number is .8 and for California’s R Number it’s .85. No model shows San Francisco over 1, whereas two models estimate over 1 for California.
A reader recently corrected me. DPH does provide current data on kids and schools. My bad. As of Oct. 22, DPH reports a total of 617 cases among students and staff, 451 in public schools. “The vast majority of these infections are occurring outside of schools.” The cumulative total number of suspected in-school transmissions is 30, and the total number of school outbreaks (3 or more cases) is 9. I assume these numbers reflect the situation since the reopening of schools in August, but it’s ambiguous. I will try to get a clarification.
The demand to reopen the economy even as the virus mutates and continues to kill around the world is symptomatic of a criminality few are brave enough to explore.
San Francisco’ s early seriousness about limiting the spread of Covid is rapidly eroding: food and shelter lines for the poor lack the careful social distancing they once had. Too many city workers (arrogant police worse among them) don’t wear masks or wear ineffective “chin-diapers.” Buses are dangerously crowded, and we learn many drivers have not yet been vaccinated!
The disease can be eradicated, but it takes a fearlessness and seriousness that our leaders appear unable to take when they are so distrusted.