
Good morning, Mission, and welcome to Virus Village, your (somewhat regular) Covid-19 data dump.
This week San Francisco has seen a small uptick in cases, a small downtick in hospitalizations and increased transmission rates among R Number models.
Looks like boosterism may be with us for a while. Now a fourth shot has been approved for people who are immunocompromised. Boosters may help stem a winter surge as the extra shots boost antibodies for a while before fading. Booster logic may stick around much longer, especially if the U.S. Centers for Disease Control changes the definition of “fully vaccinated.” Meanwhile, three times as many boosters are being delivered around the world than first shots in low-income countries.
The latest information from the National Institutes of Health says two shots of the Moderna vaccine provide “long-lasting immune memory.”
The San Francisco Department of Public Health has not reported on hospitalizations and deaths among the vaccinated since Sept. 17. DPH says it stopped reporting “to conduct a thorough review of data quality and completeness.” Why not try this simple cut-and-paste framework from Oregon who probably won’t sue SF for ripping it off.
A local mom has written a piece in SFGate denouncing local restauranteur and wino Gavin Newsom for keeping public schools closed (while sending his kids to open private schools). She vamps on the teachers’ union, but since when do campaign contributions determine public health policy?
No need for the obvious answer. At least Newsom didn’t go full Toronto in the schools (yet).
Note: DPH hasn’t reported on transmission in schools since June 11.
And if you’re looking for a boost to get you into the weekend, check this out. Merck (maker of a new pill to treat covid) will make its technology and formula available for cheap production and distribution in low income countries!! According to the article, Merck’s decision was at least in part informed by earlier protests when activists targeted the company for resisting affordable priced HIV drugs.
Scroll down for today’s covid numbers.
The U.S. Centers for Disease Control data used for the chart lags behind the data supplied from the San Francisco Department of Public Health. As of Oct. 27, DPH reports more than 81 percent of all San Francisco residents have received one dose, and 76 percent are completely vaccinated. For those over 12, better than 89 percent have received one dose and 84 percent are fully vaccinated. New vaccinations, though low, keep on truckin’. On Oct. 27, the seven-day rolling average of shots per day was 267 (we don’t know how many were boosters).For information on where to get vaccinated in and around the Mission, visit our Vaccination Page.
On Oct. 21, DPH reports there were 41 covid hospitalizations, or about 4.7 per 100,000 (based on an 874,000 population). DPH has not reported breakthrough hospitalizations and deaths since Sept. 17 in order “to conduct a thorough review of data quality and completeness.” According to the CDC, there were 33 new admissions for the seven days ending Oct. 26 (-15.38 percent from the previous seven days). For the week ending Oct. 26, covid patients accounted for 2.34 percent of hospital beds (no change from the previous week) and 4.2 percent of ICU beds (-1.41 percent from the previous week). As of Oct. 18, the CDC says that, of more than 189 million vaccinated U.S. residents, 41,127 patients with a covid vaccine breakthrough infection were hospitalized or died (though 26 percent were either aymptomatic or not covid related). Note: 85 percent of the deaths and 66 percent of the non-fatal hospitalizations were among those 65 and older.
The latest report from the federal Department of Health and Human Services shows Zuckerberg San Francisco General Hospital with 7 covid patients and 6 ICU beds available, while across the Mission, CPMC had 4 covid patients and 3 ICU beds available. Of 54 reported covid patients, 29 were at either SFGH or UCSF, with at least 75 ICU beds available among reporting hospitals. The California DPH currently reports 69 ICU beds available in San Francisco. SFDPH won’t say.
Note: DPH uses dated population figures for neighborhoods. As of Oct. 27, DPH estimates 83 percent of Mission residents have received at least one dose of The Vaccine. We are running well behind FiDi/South Beach, 98 percent, Bayview Hunters Point, 94 percent and six other neighborhoods. DPH still reports Lakeshore as the City’s outlier with 45 percent of its residents receiving at least one dose.
On October 21, the 7-day average of daily new cases in the City was 54, or approximately 6.2 new cases per day per 100,000 residents (based on an 874,000 population). The 7-day average case rate among vaccinated residents was 5.2 per 100,000 fully vaccinated residents and for unvaccinated residents 10.4 per unvaccinated 100,000 residents.
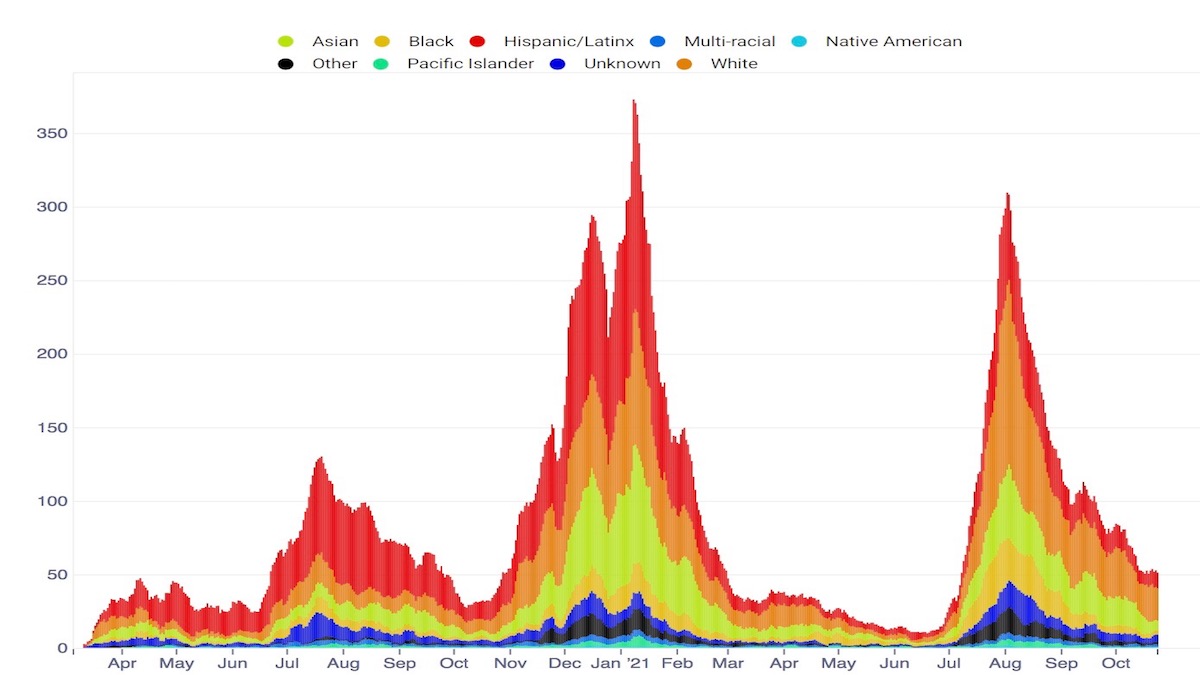
As of October 27, DPH estimates approximately 90 percent of Pacific Islanders and Native Americans have received at least one dose of The Vaccine; Latinxs 84 percent, Asians 81 percent, Blacks 72 percent while approximately 69 percent of White San Franciscans have received one dose. Note: DPH uses dated population data in its estimates.
As of Oct. 24, DPH estimates the October positivity rate for Native Americans is 4.2 percent, Pacific Islanders 2.1 percent, Latinxs 1.7 percent, Multi-racials 1.6 percent, Whites 1.5 percent, Blacks 1.4 percent and Asians 1.2 percent.
Covid-related deaths in San Francisco have always been among the most ambiguous numbers. The City no longer bothers to define what constitutes a covid (or covid-related) death. Nonetheless, five new deaths have been recorded in October bringing the Delta total so far (August – October) to 84 and the cumulative covid-related death toll to 661. September and October numbers should be considered “less reliable” meaning updates are likely.Last spring’s surge resulted in approximately 90 covid-related deaths recorded between August and October. For over a month, DPH has not reported on vaccination ststus and covid-related death.
Covid R Estimation raised its San Francisco R Number to .99 and revised its estimate for the California R number upward to a surprising 1.25. The ensemble is also suggesting increased transmission. The current average for the San Francisco R number is .83 and for California’s R Number it’s .94. No model shows San Francisco over 1, whereas two models estimate over 1 for Callifornia.
As of Oct. 23,, DPH reports 28 October cases and 0 October covid related deaths among the unhoused; 3 October cases and 0 deaths in nursing homes (“Skilled Nursing Facilities”) ; 39 October cases and 2 covid related deaths in Single Room Occupancy hotels (SROs).