
Good morning, Mission, and welcome to Virus Village, your (somewhat regular) Covid-19 data dump.
Other than a jump in reported September covid-related deaths, the numbers remain remarkably stable.
According to something called the COVID-19 Scenario Modeling Hub, infections nationally will continue a slow steady decline through March (implying no winter surge). But one doctor associated with the Hub warned about “too much optimism.”
Trying to track public health rules and guidance can be as tricky as tracking the virus itself. This week, amid heightened scrutiny and a paucity of efficacy and safety evidence, scientists with the Food and Drug Administration and the Centers for Disease Control wrestled with the question of boosters.
As of Thursday night, the FDA had made its recommendation and so had the CDC advisory committee. This morning the director of the CDC contradicted her advisors, so you are not alone if you’re uncertain if you are eligible for a booster or not.
Given substantial ambiguity in the guidance, and as the San Francisco Department of Public Health has previously signalled “accommodation“, most likely, whoever wants a booster will be able to get one, if not immediately, then soon.
Vaccine-induced antibodies may or may not wane, but unused doses will definitely soon expire.
Though Biden told world leaders “we have to go big”, his offer of 500 million doses isn’t nearly big enough. It will help, and it’s “better than nothing,” but fighting a global pandemic takes more than charity.
The Washington Post has a good visual showing that the regions in the U.S. with low vaccination rates are regions with high hospitalization rates. Note California.
Meanwhile, on the (relatively) good news front:
Have school reopenings fueled the Delta surge? Data out of Los Angeles, based on extensive testing of students and staff, suggests otherwise. Infections are generally low among unvaccinated children, and extremely low among children who were quarantined due to close contact with a classmate who tested positive.
Some think that data out of NYC confirms that the vaxxed transmit less of the virus than the unvaxxed (others are not so sure).
And finally, a new treatment in pill form may be available soon. How anti-vaxxers, anti-maskers and covid deniers will respond is anybody’s guess.
Scroll down for today’s covid numbers.
The U.S. Centers for Disease Control data used for the chart lags behind the data supplied from the San Francisco Department of Public Health. Here, the vaccination picture continues to be relatively static. As of Sept. 23, DPH still reports more than 79 percent of all San Francisco residents have received one dose, and now 74 percent are completely vaccinated. On Sept. 23, the seven-day rolling average of shots per day dropped again, to 219. For information on where to get vaccinated in and around the Mission, visit our Vaccination Page.
On Sept. 20, DPH reports there were 67 hospitalizations, or about 7.7 per 100,000 (based on an 874,000 population). The latest update from DPH says 77 fully vaccinated San Franciscans have been hospitalized (a rate of 12.6 per 1,000 cases, compared to 85.1 per 1,000 cases for those not fully vaccinated) . According to the CDC, there were 47 new admissions for the week ending Sept. 21 (-7.84 percent from the previous week). For the week ending Sept. 21, covid patients accounted for 3.57 percent of hospital beds (-.69 percent from previous week) and 8.42 percent of ICU beds (.79 percent from previous week). As of Sept. 13, the CDC says that, of more than 178 million vaccinated U.S. residents, 15,790 patients with a covid vaccine breakthrough infection were hospitalized or died (though between 17 percent of deaths and 20 percent of hospitalizations did not have symptoms of covid, or their hospitalization or death was not covid-related).
The latest report from the federal Department of Health and Human Services shows Zuckerberg San Francisco General Hospital with 15 covid patients and 74 percent ICU occupancy, while across the Mission, CPMC had 7 covid patients and 61 percent ICU occupancy. Of 82 reported covid patients, 47 were at either SFGH or UCSF.
Between July 21 and Sept. 19, the Mission had 759 new cases (a rate of 129 new cases per 10,000 residents), while Bayview Hunters Point had 879 cases for a rate of 232 new cases per 10,000 residents. The Mission , Bayview Hunters Point and Sunset Parkside (601 new cases) are the only neighborhoods in the City with more than 500 new cases.
DPH reports for the week ending Sept. 16, the seven-day rolling average of daily new cases in the city was 102, or approximately 11.6 new cases per day per 100,000 residents (based on an 874,000 population). According to the latest from DPH on Sept. 17, the 7-day average case rate among fully vaccinated residents was 7.2 per 100,000 fully vaccinated residents and 17.4 per not fully vaccinated 100,000 residents.
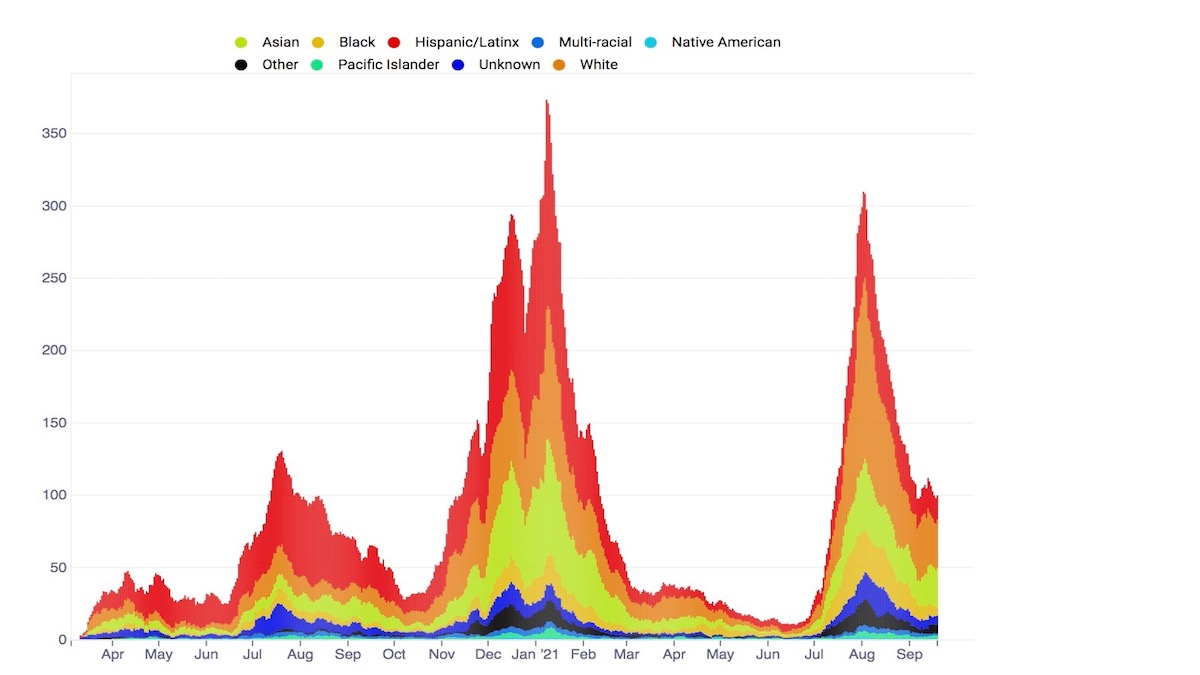
Did shelter-in-place contribute to infection disparities? Without restrictions during Delta, infection numbers line up much closer to population percentages. So far in September, Whites have had 35.1 percent of recorded infections, Asian residents had 22.7 percent, Latinxs 18.8 percent, Blacks 8.6 percent, Multi-racial residents 2.1 percent, Pacific Islanders 1.7 percent and Native Americans .4 percent of the month’s recorded infections.
So far in September, Native Americans have a 3.7 percent positivity rate, Pacific Islanders 3.6 percent, Latinxs 3.5 percent, Blacks 2.9 percent, Whites 2.1 percent and Multi-racials have a 1.5 percent September positivity rate.
Our chart should be updated soon. Covid-related deaths in San Francisco are always difficult to ascertain. In the last few days, DPH added 8 more deaths in September, for a monthly total of 12 so far, bringing the cumulative covid-related death toll to 621. DPH says there are now 11 deaths of fully vaccinated San Franciscans “that are due to complications from COVID-19.”
Covid R Estimation has kept its estimate of the San Francisco R Number at .85 and its estimate for the California R number to .88. All models in the ensemble estimate the San Francisco R Number below .9, with an average of .78, while the average California R Number has fallen to a surprisingly low .69. The ensemble average estimate for San Francisco has been below 1 since Aug. 3 and for California below 1 since Aug. 30.
The overall population percentages have changed, due to the 2020 Census. For the time being, we will continue to use use the figures provided by SFDPH. So far in September, SF residents between 0-4 account for 3.2 percent of the month’s recorded infections, those 5-10 6.4 perecent, those 11-13 2.1 percent, those 14-17 1.6 percent, those 18-20 2.5 percent, those 21-24 8.5 percent, those 25-29, 14.3 percent, those 30-39 23 percent, those 40-49 13.8 percent, those 50-59 10.7 percent, those 60-69 7.8 percent, those 70-79 and 3.8 percent, and those 80 and above accounted for 2.3 percent of September cases.
Thanks again, Mark, for breaking down these statistics. And thanks, Mission Local, for keeping this important column going.