
Good morning, Mission, and welcome to Virus Village, your (somewhat regular) Covid-19 data dump.
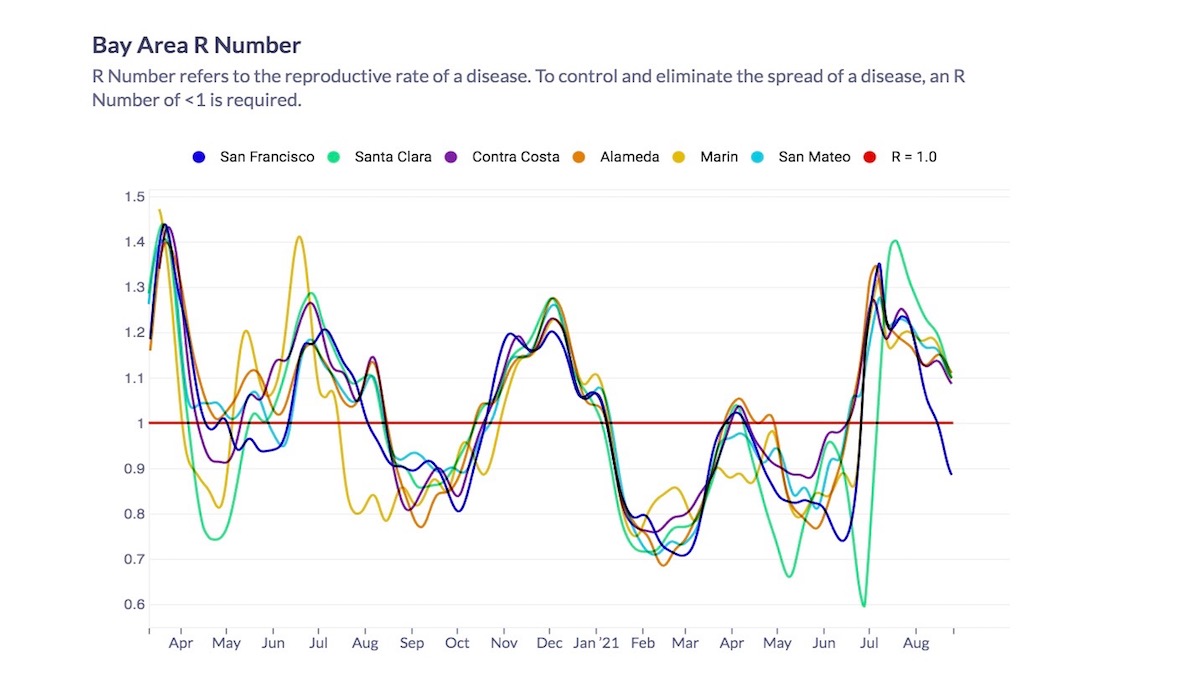
The virus remains, as it has now for at least a week, on a high plateau in San Francisco. Most encouraging are the R Number models which estimate the transmissiblity of the virus well below 1.
Want to get the numbers down fast? As the states of Georgia and Florida demonstrate, it doesn’t take vaccines or masks. Just stop reporting.
How about a booster for Johnson & Johnson vaccine recipients?
The debate around “waning immunity” and the value of “boosters” still flourishes. Some think the winter’s vaccine euphoria set us up for disappointment, while others continue to demonstrate the vaccines are doing what they were designed to do, and it’s the immune system (T and B memory cells), not antibodies, which provide long term protection against severe sickness and death.
So what comes next (next year, not next week)? I bet Dr. Pathology the virus would wane in the United States as most people either get infected or get vaccinated. Dr. Pathology took a grimmer view (he’s a pathologist, after all) asserting the virus has confounded us at every stage so far. He’s got facts on his side, but I’ve got speculation. Here’s the best piece I’ve seen on what we might see.
The Washington Post has an excellent article on the network of virus labs funded by the National Institutes of Health and the National Institute of Allergy and Infectious Diseases since 2001. After leaks and alarms were raised during the Obama Administration, new regulations were instituted and an independent committee was set up to pass on any research projects. Over the past four years, Drs. Francis Collins and Anthony Fauci oversaw the watering down of regulations, the sidelining of the committee, and a redefinition of the extremely dangerous “gain-of-function” research. The Post uncovered at least 18 projects between 2012 and 2018 that “appeared to include gain-of-function experiments.” As longtime critic Richard Ebright, a professor of chemical biology at Rutgers University who has studied biosecurity risks, says, “This kind of research can give rise to a pandemic.”
Scroll down for today’s covid numbers.
The U.S. Centers for Disease Control data used for the chart lags behind the data supplied from the San Francisco Department of Public Health. As of Aug. 26, DPH reports more than 78 percent of all San Francisco residents have received one dose, and more than 72 percent are completely vaccinated. On Aug. 26, the seven-day rolling average of shots per day to new recipients was 583. For information on where to get vaccinated in and around the Mission, visit our Vaccination Page.
On Aug. 21, DPH reports there were 116 hospitalizations, 77 in acute care, 39 in the ICU. The latest update from DPH says 63 fully vaccinated San Franciscans have been hospitalized (a rate of 13.4 per 1,000 cases compared to 79.2 per 1,000 cases for those not fully vaccinated) . According to the CDC, for the seven days ending Aug. 24, there were 90 new admissions to SF hospitals, a 4.65 percent increase over the prior seven days. Again, relying on CDC data (as SFDPH no longer bothers), for the week ending Aug. 24, covid patients accounted for 6.13 percent of hospital beds (no change) and 14.65 percent of ICU beds (a .81 percent increase). Again according to the CDC, of 171 million vaccinated residents in the country, 11,050 “patients with Covid-19 vaccine breakthrough infection” were hospitalized or died. Of those, 25 percent had no covid symptoms or their hospitalization or death was not covid-related.
The latest report from the federal Department of Health and Human Services shows SFGH with 19 covid patients and 79 percent ICU occupancy, while across the Mission, CPMC had 17 covid patients and 76 percent ICU occupancy. Of 122 reported covid patients, 58 were at either SFGH or UCSF.
Between June 23 and Aug. 22, DPH reported 689 new cases among Mission residents (or 117 new cases per 10,000 residents) and 795 new cases in Bayview Hunters Point (210 new cases per 10,000 residents). During this period, only the Mission and Bayview Hunters Point had more than 600 new cases. Sixteen neighborhoods had rates over 100 per 10,000 residents.
For the week ending Aug. 19, the seven-day rolling average of daily new cases in the city was 171 new cases, or approximately 19 new cases per day per 100,000 residents (based on an 896,000 population).
As of Aug. 20, White San Franciscans had 35.1 percent of August positive tests; Latinx, 22.1 percent; Asians, 16.5 percent; Blacks, 11.5 percent; Multi-racial residents, 1.5 percent; Pacific Islanders, 1.7 percent; and Native Americans had .3 percent of positive tests collected so far in August.
On Aug. 18, the Citywide average positivity rate dropped below 4 percent for the first time since July 15.
Covid-related deaths in San Francisco are always difficult to ascertain. Now DPH reports 2 more in August, bringing the covid-related death toll to 583. DPH provides no demographic data for monthly deaths. DPH also asserts that 2 of the covid-related deaths were those fully vaccinated.
R Number estimations are notoriously fickle. Expect to see more fluctuations, but for a bright Friday morning, things look very good from an R Number standpoint. Covid R Estimation has lowered its San Francisco R Number to .89, and its estimate for the California R number to 1.16. All models in the ensemble now estimate the San Francisco R Number below 1, with an average of .81, while the average California R Number is 1.
As of Aug. 22, DPH reports 2,264 positive tests among the males (55.1 percent) and 1801 among females (43.8 percent), 2 among trans females and 2 among trans males.