
Good morning, Mission, and welcome to Virus Village, your (somewhat regular) Covid-19 data dump.
The recent standoff between The Virus and The Vaccine in San Francisco continues, with no big advances for either side.
Unfortunately what we know is mostly what we don’t know. The antiquated, defunded and ignored national public health patchwork (let’s not call it a “system”) continues to leave the nation mainly flying blind when it comes to how well The Vaccine (and which vaccine) is working against the Delta variant.
A new study (preprint) indicates, as have many before, that the vaccine provides long term immunity against symptomatic disease and hospitalization. And, though often conflated, remember that there is a difference between an infection and getting sick.
As there is a difference between business and health care. “It makes it hard to run a business that is financially successful if you’re altruistic,” says one former nonprofit hospital CEO. In the name of protecting hospitals, we have accepted all kinds restrictions. Yet, according to a Kaiser Health Network analysis of U.S. Internal Revenue Service filings: “[t]ogether, nonprofit hospital systems held more than $283 billion in stocks, hedge funds, private equity, venture funds and other investment assets in 2019,” the analysis found. Of that, nonprofit hospitals classified only $19 billion, or 7 percent, of their total investments as principally devoted to their nonprofit missions rather than producing income.” (emphasis added)
Let’s hear it for the Board of Education. It took a while for them to figure it out, but school classrooms will soon be outfitted with air purifiers. When? “As soon as possible”. For those interested, the SFUSD provides a dashboard on testing and positivity among students and staff. As of Aug. 16, there were 93 positive tests reported, out of 62,800 tests collected.
On the good news front, new preprint research finds that children who contract covid usually have milder symptoms and recover faster than adults.
Finally, for those who may have thought the anti-parasite drug ivermectin might help against covid, think again (before it’s too late).
Scroll down for today’s covid numbers.
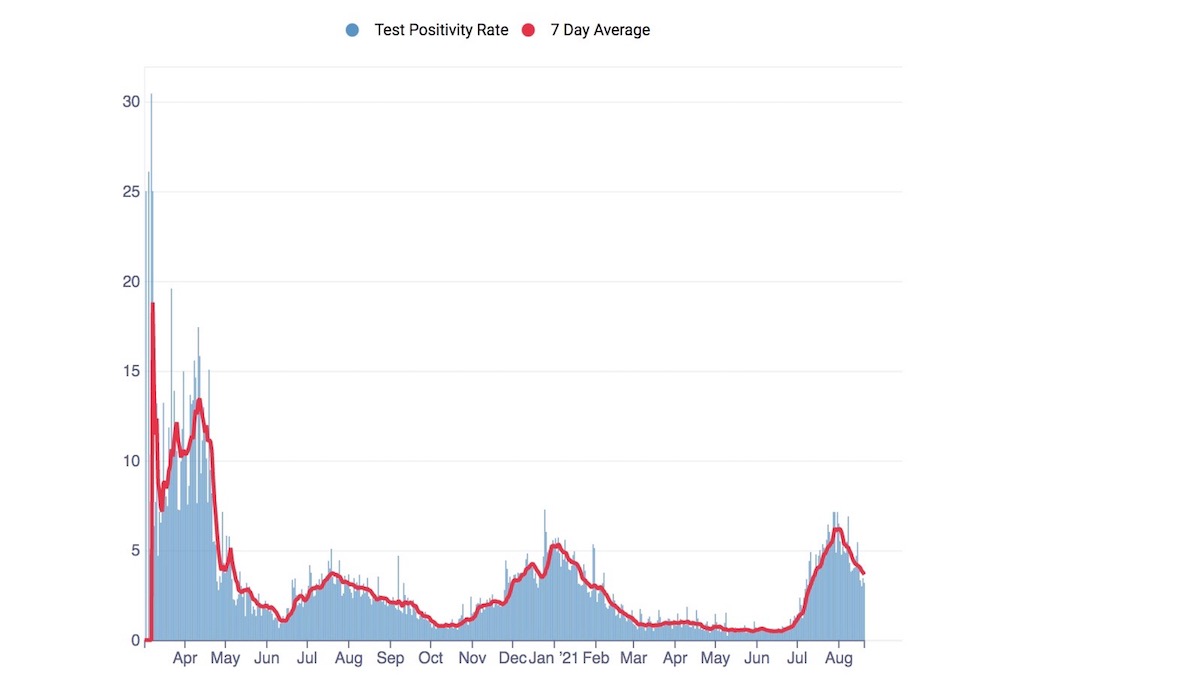
The U.S. Centers for Disease Control data used for the chart lags behind the data supplied from the San Francisco Department of Public Health. The Delta surge has yet to provoke a vaccination surge in SF. As of Aug. 24, DPH reports more than 78 percent of all San Francisco residents have received one dose, and more than 72 percent are completely vaccinated. On Aug. 24, the seven-day rolling average of shots per day to new recipients was 605. For information on where to get vaccinated in and around the Mission, visit our Vaccination Page.
On Aug. 21, DPH reports there were 117 hospitalizations, 77 in acute care, 40 in the ICU. The latest update from DPH says 45 fully vaccinated San Franciscans have been hospitalized (a rate of 10.9 per 1,000 compared to 79.3 per 1,000 for those not fully vaccinated) . According to the CDC , for the seven days ending Aug. 22, there were 82 new admissions to SF hospitals, a 9.89 percent decrease over the prior seven days. Again, relying on CDC data (as SFDPH no longer bothers), for the week ending Aug. 22, covid patients accounted for 6 percent of hospital beds (no change) and 13.77 percent of ICU beds (no change).
The latest report from the federal Department of Health and Human Services shows SFGH with 19 covid patients and 79 percent ICU occupancy, while across the Mission, CPMC had 17 covid patients and 76 percent ICU occupancy. Of 122 reported covid patients, 58 were at either SFGH or UCSF.
Between June 21 and Aug. 20, DPH reported 680 new cases among Mission residents (or 116 new cases per 10,000 residents) and 760 new cases in Bayview Hunters Point (200 new cases per 10,000 residents). During this period, only the Mission and Bayview Hunters Point had more than 600 new cases. Six other neighborhoods had more than 300 new cases, including the Castro, SOMA, Western Addition, Tenderloin, Excelsior and Sunset/Parkside. The Castro continues to have the second highest rate, at 168 new cases per 10,000 residents. Fifteen neighborhoods have rates over 100 per 10,000 residents. Seacliff had nine new cases.
For the week ending Aug. 15, the seven-day rolling average of daily new cases in the city was 170 new cases, or approximately 19 new cases per day per 100,000 residents (based on 896,000 population).
As of Aug. 20, White San Franciscans had 35.1 percent of August positive tests; Latinx, 22.1 percent; Asians, 16.5 percent; Blacks, 11.5 percent; Multi-racial residents, 1.5 percent; Pacific Islanders, 1.7 percent; and Native Americans had .3 percent of positive tests collected so far in August.
Between June 18 and Aug. 20, DPH reports that the positivity rate in the Mission was 4.6 percent. In Bayview Hunters Point, the positivity rate was 6.9 percent. The Castro had a positivity rate of 5.4 percent, while Seacliff and Glen Park had positivity rates of approximately 2 percent.
Deaths in San Francisco are always difficult to ascertain. Now DPH reports 10 more, bringing the total covid-related death toll to 581. DPH provides no demographic data for monthly deaths. DPH also asserts that two of the August Covid-related deaths were those fully vaccinated.
The relative standoff between The Virus and the Vaccine is reflected in the R Number. Covid R Estimation has lowered its San Francisco R Number slightly below 1 to .98, and its estimate for the California R number to 1.18. Most models in the ensemble estimate the San Francisco R Number below 1, with an average of .83, while the average California R Number is 1.03.
As of August 20, DPH reports 78 positive tests among the unhoused. There have been a total of six unhoused covid-related deaths.
Not sure about those SFUSD numbers.
Are 93 total infections was from 08/24, not 08/16. The total now is 104 for 8/25. See SFUSD COVID-19 Testing Dashboard webpage.
Note also that the “ … out of 62,800 tests collected” is not correct correlation — that number is total of student plus staff population, not total tested persons; SFUSD does not release information on tested, or vaccinated vs unvaccinated, percentage of each population — although it can be assumed that the staff vaccination percentage is higher due to higher age-eligible population — this would imply that most positive cases are affecting student population.
Thank you for discussing the “revenue generation” (vs helping those who most need it) function of our corporate hospital/medical system. Even the “non-profits.” Even in San Francisco. We cannot understand the pandemic without understanding the problems in a health care system that is supposed to be protecting us. To quote the title of an old book about this:
“Who shall live?”
SFUSD reporting as of August 16th?? That was the first day of school. Many schools have had at least one case now that we are 8 days in.
Seems like it’s in serious decline. Hopefully we don’t have to wear masks anymore, so stupid.
I agree that it would be nice to not have to deal with masks. But with ICU cases comprising a rather sizable portion of total hospitalizations, and average COVID cases still up nearly 20x their low two months ago, I wouldn’t say that COVID is in serious decline yet. Until then, masks have proven to be a valuable tool in reducing the spread of COVID, and as much as it’s a pain to deal with them on a regular basis, I’d rather deal with that pain than contract COVID (again).
Thanks again for your excellent work, Mark. And thanks, Mission Local, for keeping this important column going. It’s much appreciated during a time when this data is getting so little coverage.
I know we’re all getting tired of COVID — I sure am — but the virus doesn’t care. And I tremendously appreciate how this column helps me keep abreast of what’s going on.