Good Morning Mission, and welcome to Virus Village, your daily Covid-19 data dump.
Cases, hospitalizations and positivity rates are down again in San Francisco. Which makes it particularly jarring to read about what’s going on outside our bubble, especially in India and South America.
The exponential spread of the virus around the world threatens what has been achieved so far in San Francisco and much of the U.S. Now the Biden Administration “debates” whether to spare lives or save Big Pharma profits.
Part of the problem in South America has been using the vaccine as a political football. Brazil, the worst hit country in the hemisphere, rejected the Russian vaccine, in part due to pressure from the U.S. Really? Aren’t we sick enough of Cold War politics?
The latest CDC data shows 9245 breakthrough infections among 95,000,000 vaccinated (.0097 percent), 6720 symptomatic (.007 percent), 835 hospitalizations (.0009 percent) and 132 deaths (.0001 percent). The CDC follows the data with this note: “241 (29%) of the 835 hospitalizations were reported as asymptomatic or not related to COVID-19. 20 (15%) of the 132 fatal cases were reported as asymptomatic or not related to COVID-19.”
While waiting for The Vaccination, scroll down for today’s Covid numbers.
The CDC data used for the chart lags behind the data supplied from SFDPH. As of April 30, DPH reports 72 percent (550,852) of San Francisco residents over 16 had received one dose, and 48 percent (366,648) are completely vaccinated. On April 30, the seven-day rolling average of shots per day was 7,283. The DPH goal is 10,000 shots a day. For information on where to get vaccinated in and around the Mission, visit our Vaccination Page.
Covid-19 R Estimation maintained its estimate of the San Francisco R number slightly below .9 at .89 roughly the same as it’s California estimate. All the models in the ensemble keep the SF R Number below 1 with an average estimate of .82, while its California R Number average estimate is .86.
Between March 28 and April 26, DPH reports 68 new cases in the Mission or 11.4 new cases per 10,000 residents. Bayview Hunters Point had the highest number with 88, while the FiDi/South Beach had the highest rate at 27.2 new cases per 10,000 residents. .
For the week ending April 22, the seven-day rolling average of daily new cases in the City was 26 new cases, or 3 new cases per day per 100,000 residents.
In January, Latinx had 2604 cases, Whites 1764, Asians 1601, Blacks 444, Pacific Islanders 104 , Multi-racials 99 and Native Americans 15. As of April 25, Whites have had 270 new cases in April, Asians 145, Latinx 131, Blacks 108, Multi-racials 18, Pacific Islanders 18 and Native Americans 3 April cases
Hospitalizatlons for confirmed Covid patients is now at the lowest number since the pandemic began. For the week ending April 27, the rate of weekly change in Covid positive patients fell 15 percent. During that week, the seven-day average availability of ICU beds was 38 percent and Acute Care availability was 25 percent. On April 27, DPH reports Covid patients comprised 2.5 percent of ICU occupancy and 1.4 percent of Acute Care occupancy. DPH reports on April 27, the City had 100 percent ICU and 98 percent Acute Care surge capacity
The latest data from the Federal Health and Human Services department shows last week SFGH had 6 Covid patients and 77 percent ICU occupancy, while across the Mission, CPMC had 2 Covid patients and 44 percent ICU occupancy.
The Citywide weekly average positivity rate is now at its all-time low.
As of April 26, 448 cases in April self-identified as heterosexual, 17 gay or lesbian, 8 bisexual 2 other, 189 unknown and 44 declined to state. Of the cumulative deaths, 88 were heterosexual, 3 gay or lesbian, 400 were unknown and 5 declined to state. You’re right, that only adds up to 496 deaths.
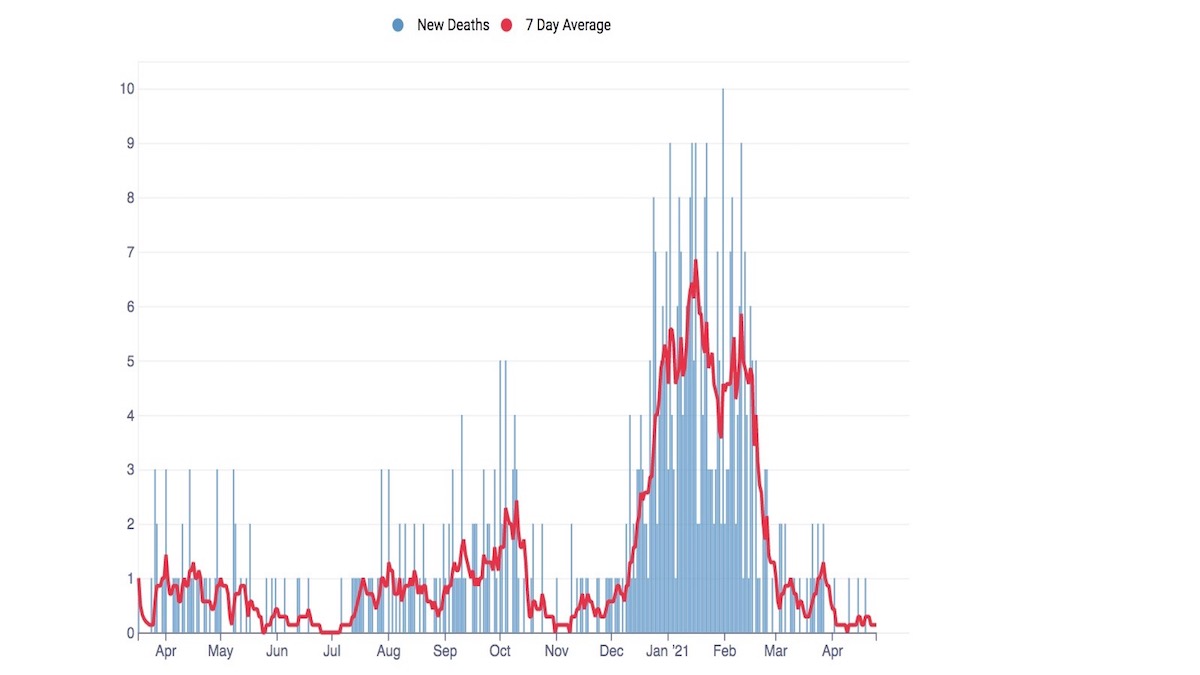
Though the 536 number is considered by DPH to be “less reliable”, San Francisco had 6 reported deaths in April.