Good Morning, Mission! Welcome to Virus Village, your daily Covid-19 data dump.
Most epidemiologists expect a fourth wave coming soon to a town near you, but when, how big, how severe remains an open question.
If you want deeper data dive, check out Peter Khoury’s graphs at the Phoenix Data Project.
Class and race disparities are not going to help avoid a fourth wave. Class data has been routinely uncollected during the pandemic and vaccination data on race/ethnicity is spotty at best.
Lydia and Annika report on efforts in the Mission and in Oakland to expand vaccinations among those most often ignored.
While waiting for The Vaccination, scroll down for today’s Covid numbers.
Waiting for The Vaccination? Join the club. As of March 7, 32.4 percent of Asians, 30.3 percent of Whites, 10 percent of Multi-racials, 9.7 percent of Latinx, 3.4 percent of Blacks and less than 1 percent of Native Americans and Pacific Islanders over 16 and living in San Francisco had received at least one shot. For information on where to get vaccinated in and around the Mission, visit our Vaccination Page.
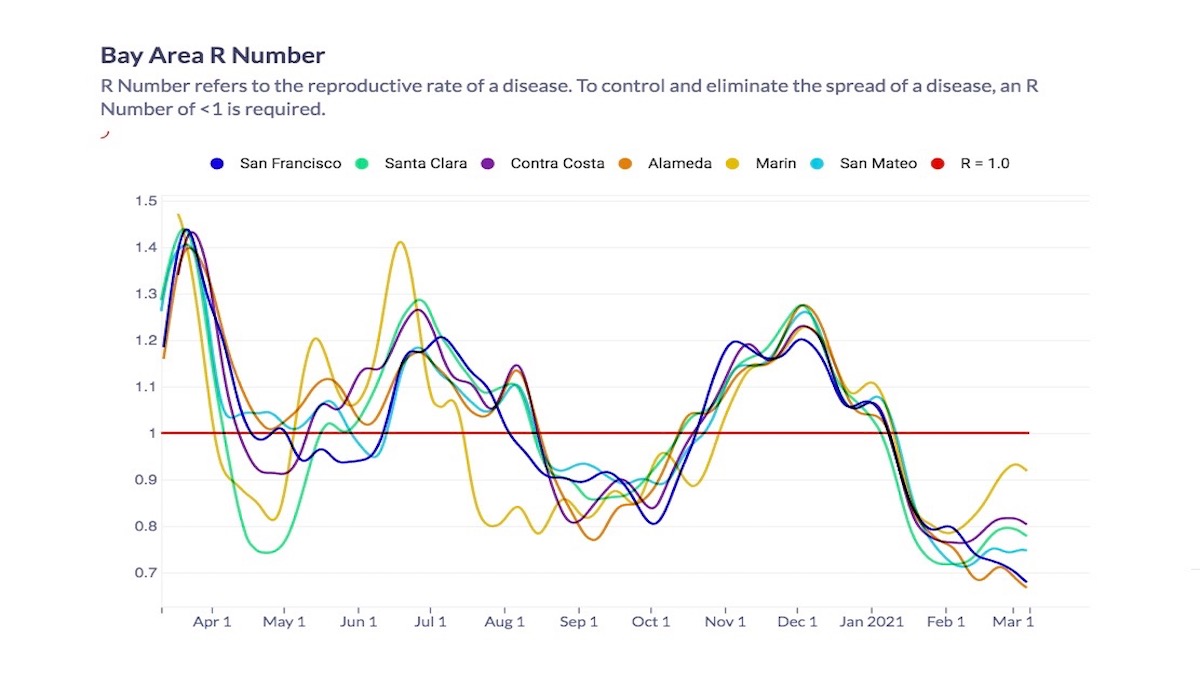
A new surge may be coming but it’s not here yet. Covid-19 R Estimation has lowered its estimate of San Francisco’s R Number to a new all-time low of .68 and the ensemble chimes in with a .67 average. Yesterday’s unexpected spike in California’s R Number has fallen back again to a range between .43 to .83 for an average of .67.
Between February 5 and March 6, DPH added 191 new cases to the Mission for a City high cumulative total of 3593 cases, or 66.3 cases per 1000 residents.
For the week ending March 1, the seven-day rolling average of daily new cases in the City was 47, or 5.4 new cases per day per 100,000 residents.
Although numbers have fallen, the Latinx population continues to suffer disproportionately from the virus. As of March 6, Latinx have a case rate of 1071 cases per 10,000 residents, Pacific Islanders have a rate of 768, Native Americans 712, Blacks 450, Multi-racials 214, Asian 210, Whites 210 while the Citywide rate is 395 cases per 10,000 residents.
Covid hospitalizations are down to where they were in mid-November. Today’s figures include 0 transfers. For the week ending March 7, the rate of weekly change in Covid positive patients fell 37 percent. During that week, the seven-day average availability of ICU beds was 33 percent and Acute Care availability was 25 percent. On March 7, DPH reported 100 ICU beds and 442 Acute Care beds available. DPH continues to report 100 percent of required PPE on hand.
Most recent numbers from the Federal Health and Human Services Department show SFGH with 6 Covid patients and 80 percent ICU occupancy. Across the Mission, CPMC has 7 Covid patients and 39 percent ICU occupancy.
Between January 3 and March 6, Mission residents had a testing positivity rate of 3.69 percent based on 29,164 tests.
The 2.3 percent positivity rate is the lowest the state has seen since the pandemic began.
Based on the group’s population, in Februrary, those aged 14-17 had a new case rate of 34.2, 18-20 had 35.8, 21-24 34.2, 25-29 30, 30-39 25, 40-49 27.6, 50-59 29.9, 60-69 25.3, 70-79 24.6. and 80+ 28.2 while the Citywide rate was 27.8.
Underlying conditions (other than old age) were present in over 67 percent of San Francisco’s Covid related deaths, while 2.3 percent had no such conditions. For the rest, over 30 percent, the presence of underlying conditions was unknown. Although no explanation is given for the high percentage of unknowns, one possible reason is the lack of health insurance/health provider information.
Amazing deaths continue to pale in comparison to drug overdoses yet dealers out and about in such numbers its more of a rarity to not see them dealing in the Tenderloin and 16th St Bart station. Why such half hearted urgency from our politicians?