Good Morning, Mission! Welcome to Virus Village, your daily Covid-19 data dump.
Mayor Breed and Director Colfax announced San Francisco will into the more open Orange Tier. Good luck. Let’s hope it lasts longer than the last time.
As we know it’s been a difficult year for local small business. Julian talks about the near future with three of those affected.
One of the most important lessons learned this year is the key role community engagement plays in public health. Listen to long-time ML reporter Laura Wenus’ interview UCSF’s Dr. Kim Rhoads and Dr. Carina Marquez.
In a week when anti-Asian American violence caught the nation’s attention, Joe reports on the tweet storm hitting San Francisco’s Board of Education.
But the Board of Education controveries don’t generate nearly as much heat as the latest installment of Burger Wars.
While waiting for The Vaccination, scroll down for today’s Covid numbers.
The problems with the California Immunization Registry have yet to be resolved, meaning these numbers may be underreported. As of March 23, 39 percent (283,156) of San Francisco residents over 16 had received one dose, while 19 percent (136,090) had received two. On March 23, the seven-day rolling average of shots per day was 6,925.7 . The DPH goal is 10,000 shots a day. For information on where to get vaccinated in and around the Mission, visit our Vaccination Page.
Estimating a virus’ transmission rate is not what you would call an “exact science”. Looking at the R Number reports today reflects a great deal of uncertainty. After pegging the local R Number below .7 for over a week Covid-19 R Estimation has now revised those estimates and puts the San Francisco R Number in a range between .65 and 1.04 with the average at .85. Likewise the models that make up the ensemble estimate the SF R Number in a range from .20 to .95, for an average of estimate of .79. Estimates for the California R Number fall between .34 and .85.
Between February 20 and March 21, DPH added 124 new cases to the Mission or 21 new cases per 10,000 residents. Apparently counting cases is not an exact science either. Adding more confusion than clarity, DPH reports 218 new cases in the area bounded by 22nd, 17th, Valencia and South Van Ness and 169 new cases in the area bounded by Valencia, South Van Ness, 17th and Market. Another good reason to look at trends and general comparisons rather than absolute numbers.
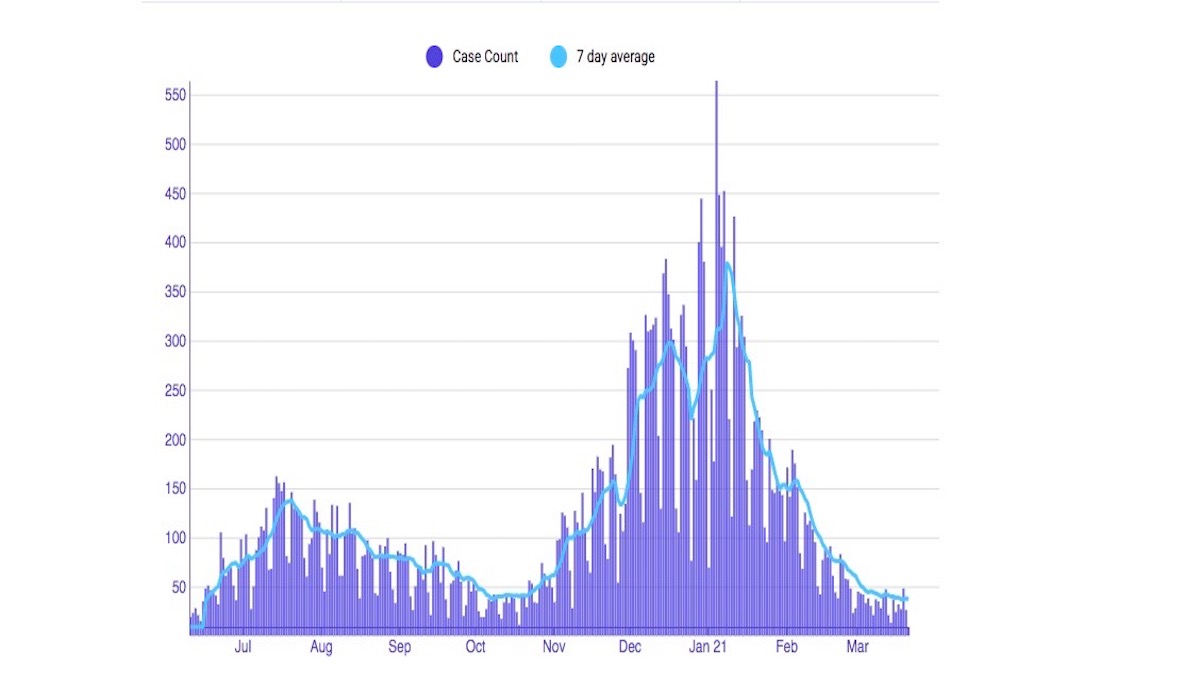
For the week ending March 16, the seven-day rolling average of daily new cases in the City was 30 or 3.4 new cases per day per 100,000 residents.
As of March 21, based on the group’s populaton size, Pacific Islander residents had a new case rate of 40.8, Latinx 12.3, Blacks 11.7, Multi-racials 7.3, Whites 6.4, Asians 4.6, and “Other” 98.5. The Citywide case rate was 7.7.
Today’s figures include 0 ICU transfers and 1 Acute Care transfer. For the week ending March 22, the rate of weekly change in Covid positive patients fell 12 percent. During that week, the seven-day average availability of ICU beds was 33 percent and Acute Care availability was 25 percent. On March 22, DPH reports Covid patients occupied 2.8 percent of ICU beds and 2.1 percent of Acute Care beds. DPH says capacity for a potential surge is 100 percent in ICU and 95 percent in Acute Care.
From the latest numbers supplied by the Federal Department of Health and Human Services, 62 percent of the City’s Covid patients are at UCSF, Kaiser and SFGH .
The Citywide average positivity rate has been below 1 percent since March 4.
So far in March, men haven tested positive for the virus 347 times (51.6 percent) and women 323 times (48 percent). In February, men had 1316 positive tests (54.4 percent), women 1092 (45.1 percent), and in January men had 3635 positive tests (50.1 percent), women 3450 (49.2 percent). For March DPH reports 0 cases for trans men or trans women, 2 unknown cases and 1 case “Other.”
Based on 460 deaths (reported by the Washington Post), San Franciso has a rate of 52.9 deaths per 100,000 residents. Sacramento has a rate of 98.6, San Diego 105.8, Los Angeles 226.1, Portland 69.7, Seattle 67.1, Denver 111.8, Santa Fe 95.4, Austin 77.5, Tulsa 118.4, Minneapolis 132.3, Madison 54.4, Chicago 183.7, Detroit 239.4, Cleveland 157, Philadelphia 205.3, Queens 397.3, Bronx 425, Brooklyn 364.7 and Manhattan 251.3 cases per 100,000 residents.
I really don’t get the whole R number thing (anyone else out there agree?). Interested in doing a master class in R Mark?