Good Morning, Mission! Welcome to Virus Village, your daily Covid-19 data dump.
More Covid controversy. Is the news media hyping the variants?
The variant story was a big one during yesterday’s UCSF Grand Rounds, but not as big, or significant, as the discussion regarding class and race disparities.
For another look at the current state of the pandemic, here are three charts to check out.
And more good news from the “real world” on how well the Pfizer vaccine has prevented infection and transmission (among Israelis, not Palestinians).
That “good news” item about Pfizer comes from Pfizer itself, which has significant and persistent mold issues in its newest vaccine production plant.
Meanwhile on Valencia Street, a new housing project has been approved and a new sandwich shop has opened.
While waiting for The Vaccination, scroll down for today’s Covid numbers.
Is there a reason for the slow vaccination progress in the City. Today DPH says vaccinations in California have been underreported since March 2. For what it’s worth, DPH reports that as of March 10, 27 percent (205,347) of San Francisco residents over 16 had received one dose, while 13 percent (96,114) had received two. On March 10, the seven-day rolling average of shots per day was 4637.3. For information on where to get vaccinated in and around the Mission, visit our Vaccination Page.
If the variant is on the loose in the City, it’s still not showing up in the R Number models. Covid-19 R Estimation and the ensemble agree to estimate the San Francico R Number at a relatively low .66. They are also in substantial agreement with an estimate for the California R Number around .72.
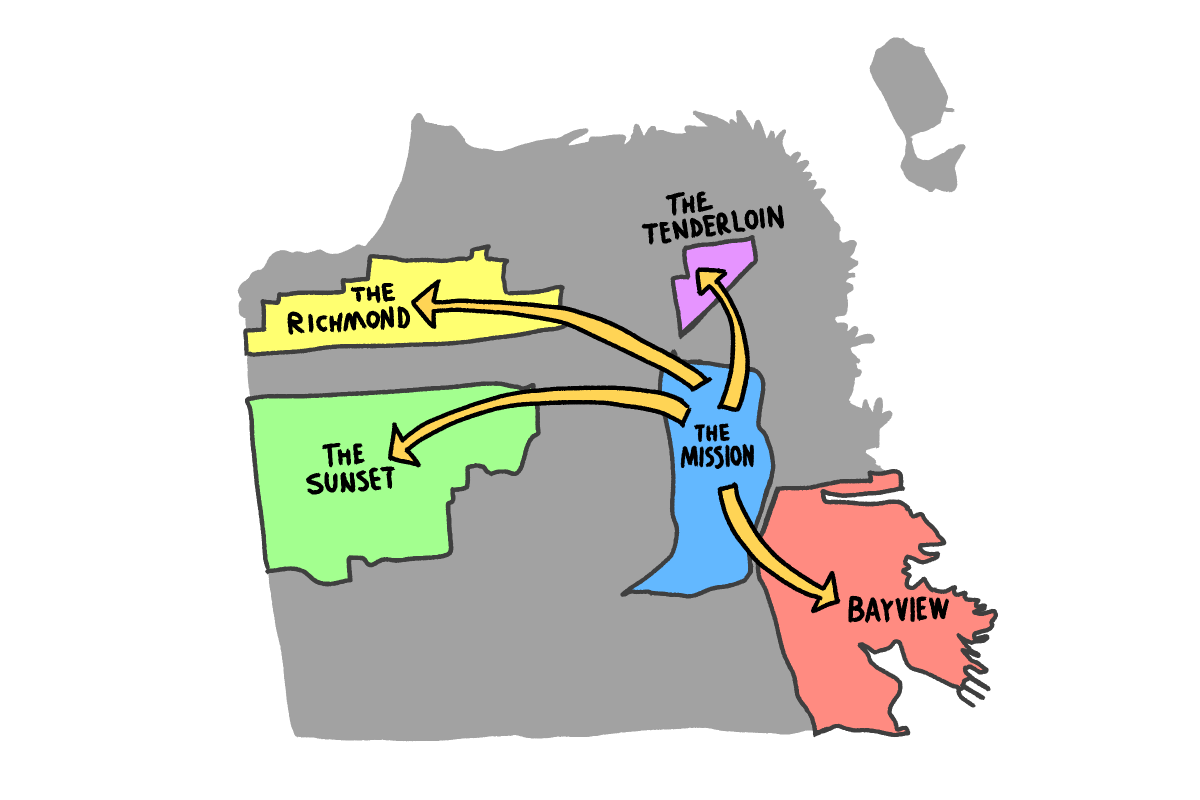
Between February 8 and March 9, DPH added 180 new cases to the Mission for a cumulative total of 3961, most in the City, or 66.4 cases per 1,000 residents. Seacliff has the lowest total with 42 or 16.9 cases per 1,000 residents. The Inner Sunset, home to UCSF, has the lowest rate at 16.3 cases per 1,000 residents.
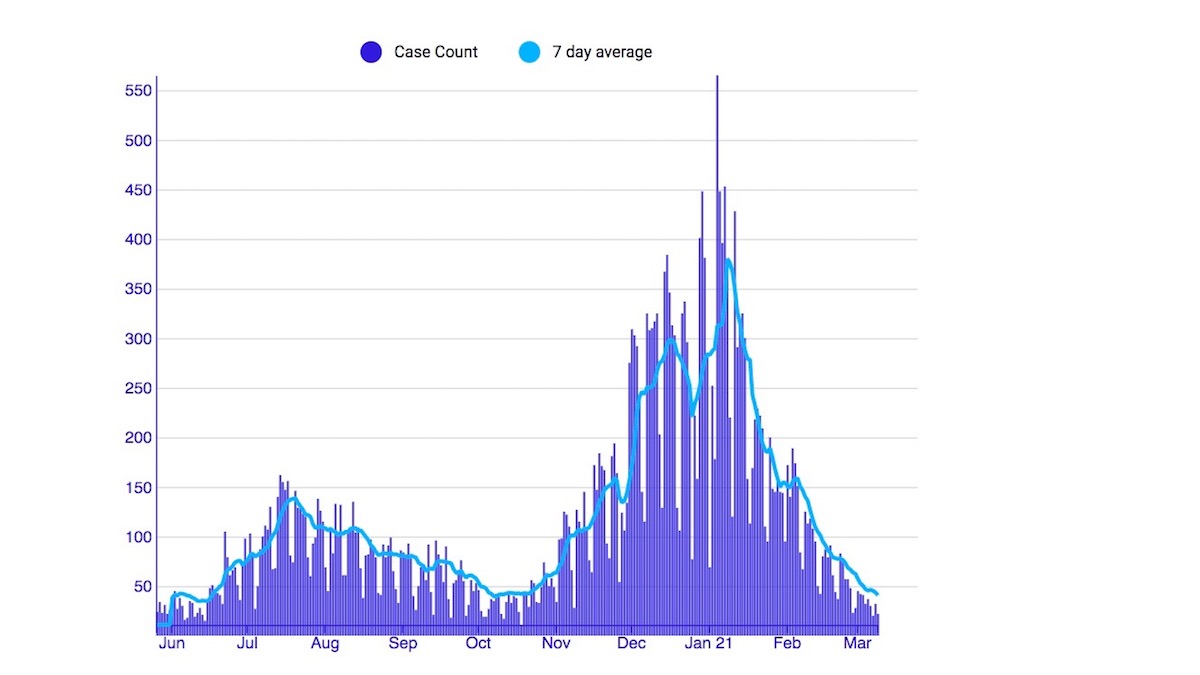
For the week ending March 4, the seven-day rolling average of daily new cases in the City was 37, or 4.2 new cases per day per 100,000 residents.
Preliminary figures indicate that as of March 8, the Latinx weekly new case average has dropped 40 percent for the month of March, White cases dropped 30 percent, Asian cases dropped 47 percent, and Black cases have dropped 29 percent.
Today’s figures include 1 ICU transfer and 1 Acute Care transfer. For the week ending March 10, the rate of weekly change in Covid positive patients fell 32 percent. During that week, the seven-day average availability of ICU beds was 32 percent and Acute Care availability was 24 percent. On March 10, 93 ICU beds and 338 Acute Care beds were available. DPH continues to report 100 percent of required PPE on hand, although this article raises questions about what kind of PPE and how that PPE is being utilized.
Between January 11 and March 9, California Covid hospitalizations have dropped over 80 percent.
The Citywide seven-day average positivity rate has dropped below 1 percent for the first time since October 25. It is another indicator of the current low prevalence of the virus in San Francisco.
In Februrary, the age group from 30 to 39 accounted for 19.2 percent of the new cases that month, while the group from 40 to 49 accounted for 13.5 percent, the group 50-59 accounted for 13.2 percent and the age group between 20 and 25 accounted for 12.5 percent of Februrary cases.