Good Morning, Mission! Welcome to Virus Village, your daily Covid-19 data dump.
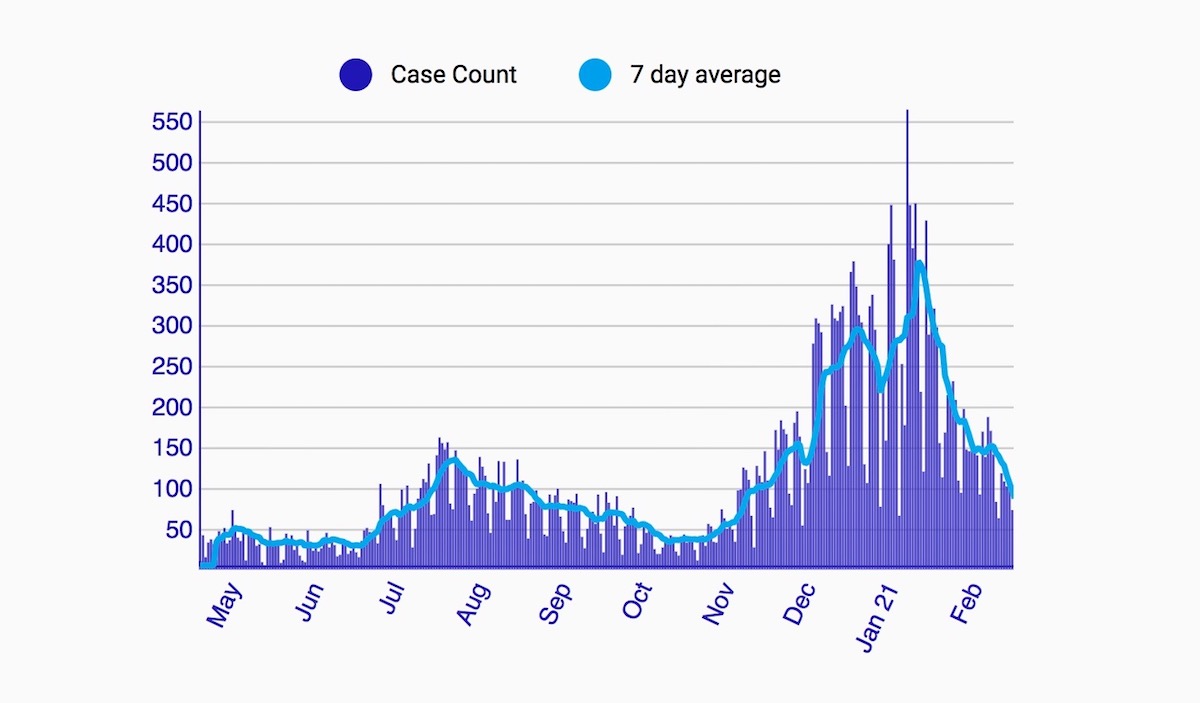
Average daily new case numbers have slipped below the peak of last summer’s surge. See below.
Why do we see ongoing reports of N95 mask shortages in hospitals and clinics while suppliers are drowning in them? Economics may have more to do with it than health.
If you’re confused about masking (and who isn’t), check out this straightforward rundown on what works where.
And while masks often make the news, the use of supplements rarely does. Today’s offering looks at supplements not as a cure to Covid, but as a boost to vaccination.
Can’t get enough of Netflix dramas? Last week, Julian wrote a piece on the strange disappearance of Mission resident Christopher Woitel. Today Julian reports Woitel been found. Dead.
While waiting for The Vaccination, scroll down for today’s Covid numbers.
Operation Snail’s Pace bumbles its way onward. As of February 15, 16 percent (121,108) of San Francisco residents over 18 have received one dose, while 5 percent (34,957) have received two. On February 14, 2595 shots were delivered to San Franciso residents, with a seven day rolling average of shots per day falling to 4058.9. For information on where to get vaccinated in and around the Mission, visit our Vaccination Page.
While estimates place San Francisco’s R Number below .85, the big news is California’s R Number, with estimates ranging from .53 to .94 for an eye-popping .65 average. Are we going to start hearing stories about the “California Miracle” again?
Between January 14 and February 12, new positive tests fell to 353 or 59.1 new positive tests per 10,000 residents. Though fewer Portola residents tested positive (191), the neighborhood’s rate was the highest in the City, with 115.3 positive tests per 10,000 residents.
Cue the trumpets! For the week ending February 8, the seven-day average of daily new cases in the City dropped below the summer surge peak to 128, or 15.9 new cases per day per 100,000 residents. The number hasn’t been this low since November 28.
Through February 13, Latinx residents had a case rate of 1042 per 10,000 residents, while Pacific Islanders had 761, Native Americans 697, Blacks 430, Multi-racial 207, White 200 and Asians 198 cases per 10,000 residents. The Citywide rate was 381 positive tests per 10,000 residents.
Today’s numbers include 1 ICU transfer, and 1 transfer in Acute Care. For the week ending February 14, the rate of weekly change in Covid positive patients dropped another 23 percent. During that week, the seven-day average availability of ICU beds was 29 percent and Acute Care availability was 23 percent. On February 14, DPH reports 99 beds available in ICU and 464 beds available in Acute Care.
Between February 1 and February 13, the Citywide Latinx positivity rate was 6.68 percent, a dramatic decrease from 11.32 percent recorded in January. Blacks had a positivity rate of 2.78 percent, Asians 2.53 percent, Whites 1.56 percent, and Multi-racial 1.49 percent.
The 14 day average positivity rate in California is at it’s lowest point since November 13.
According to CADPH, 31.8 percent of San Francisco’s Asian population has received at least one dose of the vaccine. 30.7 percent of Whites, 10.4 percent of Multi-racials, 8.3 percent of Latinx and 3.5 percent of Blacks have received at least one dose.
Cumulative Covid Deaths in San Francisco
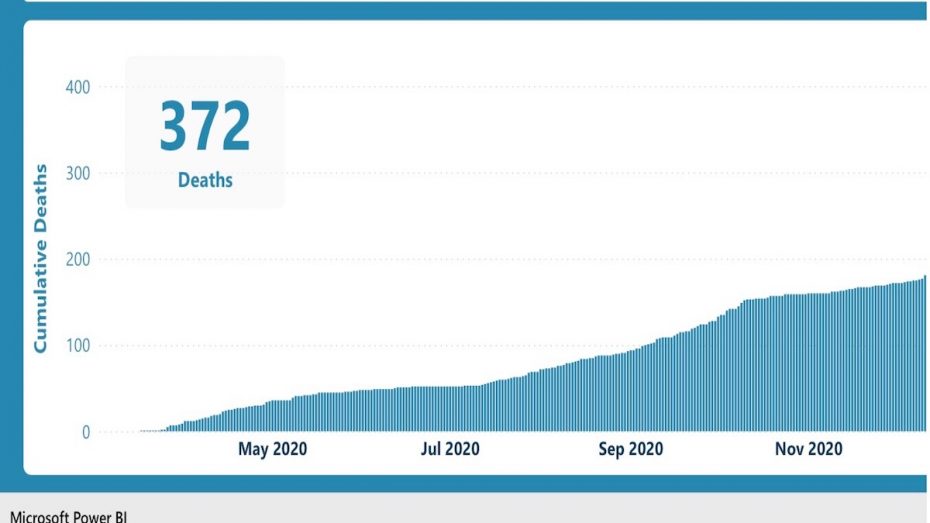
While we revise our Covid deaths graph, here’s the DPH chart taken from their website: https://data.sfgov.org/stories/s/dak2-gvuj.
Residents over 70 account for 78 percent of San Francisco’s Covid related deaths. Of those, 68.5 percent had one or more underlying condition, 2.7 percent had no underlying conditons and the rest were “unknown”
Can we hold off with indoor dining? The last time we opened it up in October, a surge began which got amplified by Halloween, Election, Thanksgiving, etc… If we had to draw a line between what’s safe and unsafe, indoor dining is that line.
It would be fantastic if you could relate our current case rate to the scale used by the CDC in the new guidance about when and how schools should open.
RE: Cue the trumpets. If the slope of the downward trend holds, by 2/13/2021, the 7-day average for cases per day will be 90. Based on the case rate adjustment factor in this week’s and last week’s CDPH Blueprint for Safer Economy, San Francisco needs to get to between 7-day average cases per day of between 85 and 102 to drop from current Purple Tier to lower Red Tier in which CDPH recommendations allow for reopening of indoor dining at 25% capacity. In a glass half-full mood today that with vaccinations and continuation of masks and social distancing, the 4th wave from B.117 and B.351 variants will be lower than the post Thanksgiving / Christmas surges and another lockdown will be avoided.