
Good Morning, Mission! Welcome to Virus Village, your daily Covid-19 data dump.
While the U.S., especially California, continues to struggle with the virus, there are other countries who have handled with situation far better. In China, the economy is humming. The Lancet has a piece, without the usual stereotypes, on how China was able to get control.
Although somewhat late and haltingly, the pandemic has brought forth a number of local testing companies and labs. The need for improved rapid testing will grow over the next year.
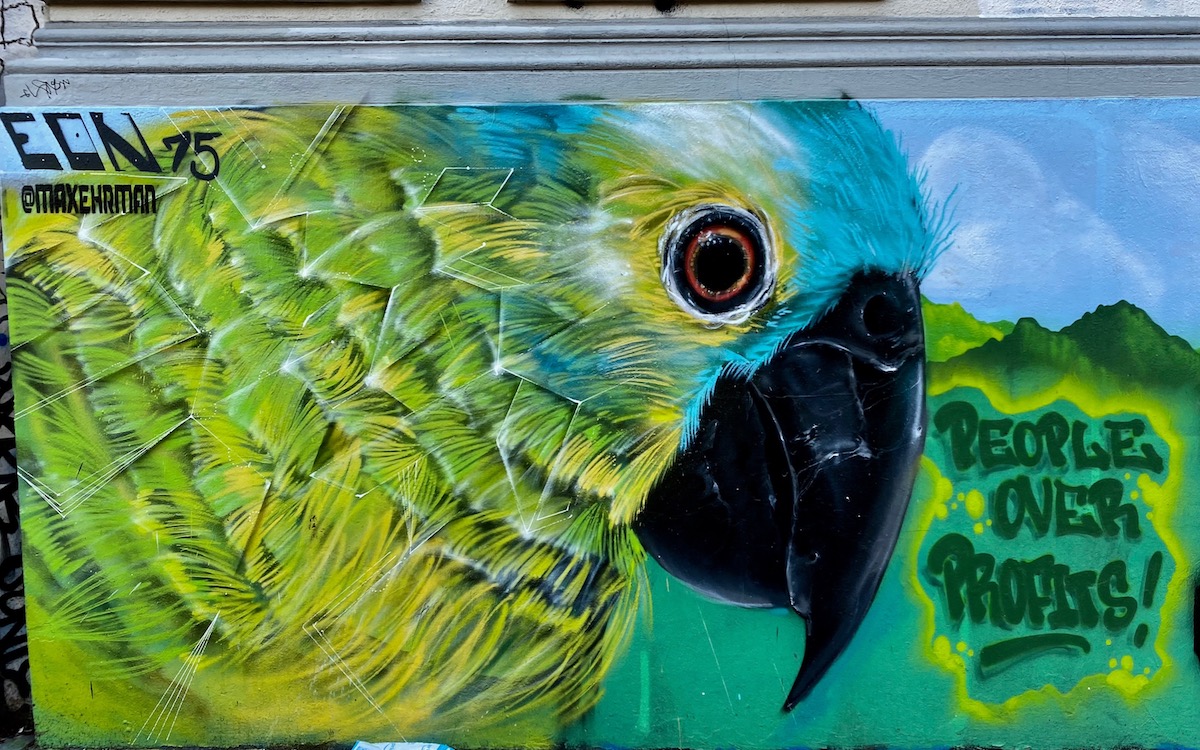
Perhaps paradoxically, the pandemic has also brought forth artistic expressions, which Mission Local has been fortunate to highlight over the year.
Following the data has been a mantra of local health officials, often seeming to be more in word than in deed. The disconnect is not unique to the DPH in a city where politics frequently takes precedence over data.
Burgers also take precedence over data.
Scroll down for today’s Covid numbers.
Between November 25 and December 24, DPH reports 712 new cases in the Mission for a total of 2813 cases, or 47.1 cases per 1000 residents. With 724 new cases over that period, for a total of 2529 cases, or 67.6 cases per 1000 residents, the data points to the need for more testing in Bayview-Hunters Point. Will DPH follow?
Current numbers, as of December 26, may reflect a holiday data delay more than reality. On December 26, DPH reports SF hospitals had 95 ICU beds and 546 Acute Care beds available. How many of those beds are actually staffed, DPH won’t say. For the week ending December 25, the weekly rate of change in Covid positive patients was 6 percent. Though below the DPH goal of 10 percent, any increase at this stage is cause for concern. During that week, the seven-day average availability of ICU beds was 31 percent and for Acute Care beds 28 percent. DPH continues to report 100 percent of required PPE on hand, but does not report on staffing, nor on the cases and deaths among hospital and healthcare workers.
The restictions put in place some weeks ago are showing up. Estimates for San Francisco’s R numbers have generally fallen to about 1.1. In general, estimates for California are falling as well, ranging between .91 and 1.27. These estimates do not take into account an expected holiday surge.
Another small dip in the numbers prior to the holiday surge. As of December 19, the seven-day average of new cases per day was 269 cases or 30.9 new cases per 100,000 residents.
Over the past two months, among Mission residents there has been 566.2 tests per 1000 residents, with a 3.78 positivity rate. Among residents of Bayview Hunters-Point, there have been 483.7 tests per 1000 residents with a Citywide high positivity rate of 6.41 percent. Potrero Hill (including Dogpatch) has the highest number tests per 1000 residents (749.6) and one of the lowest positivity rates (1.68 percent).
No change in the minimal contact tracing data provided by DPH. During the surge, tracers interviewed 69 percent of positive cases and reached 71 percent of their named contacts. Even though it has now dedicated an entire web page to contact tracing, DPH refuses to share how many tracers work how many hours, or what it knows about when and where the virus has been contracted. Although officials often point to “small private gatherings”, they do not provide data, nor do they discuss or mention, workplace transmission. It seems DPH has forgotten we paid for this data to be collected; it belongs to the public.
China is not the only country which has managed to bring the virus under relative control. A number of rarely mentionned countries with a lower number of deaths than San Francisco include Uruguay (158), Cuba (142), Congo (107), Liberia (83), Thailand (60), Vietnam (35), Singapore (29), New Zealand (25) and Taiwan (7)
I wonder how these numbers would track with PM 2.5 data.
San Mateo didn’t do the outdoor ban until much later and are seeing a similar drop in R number. What gives?