Good Morning, Mission! Welcome to Virus Village, your daily Covid-19 data dump.
The lackadaisical approach to retrofit quality control from the Department of Building Uninspection would be insane if San Francisco were built on a major fault line. Oops!
Julian reports the vote to unionize Dandelion Chocolate is too close to call.
Like in most matters, California and Texas have taken strikingly different responses to the virus and vaccination programs. How does it look at this stage?
There have been a lot of stories about “long Covid” but almost all have been individual tales. Little is understood, but that could change if medical professionals took a less “authoritarian” approach.
And Mission residents around Potrero del Sol remain unsatisfied with new plans for housing development on the edge of the park.
While waiting for The Vaccination, scroll down for today’s Covid numbers.
Note there are some discrepancies from the CDC data used for the chart and the data supplied from SFDPH. As of April 21, DPH reports 66 percent (506,962) of San Francisco residents over 16 had received one dose, and over 42 percent (326,299) are completely vaccinated. On April 21, the seven-day rolling average of shots per day was 9,798. The DPH goal is 10,000 shots a day. For information on where to get vaccinated in and around the Mission, visit our Vaccination Page.
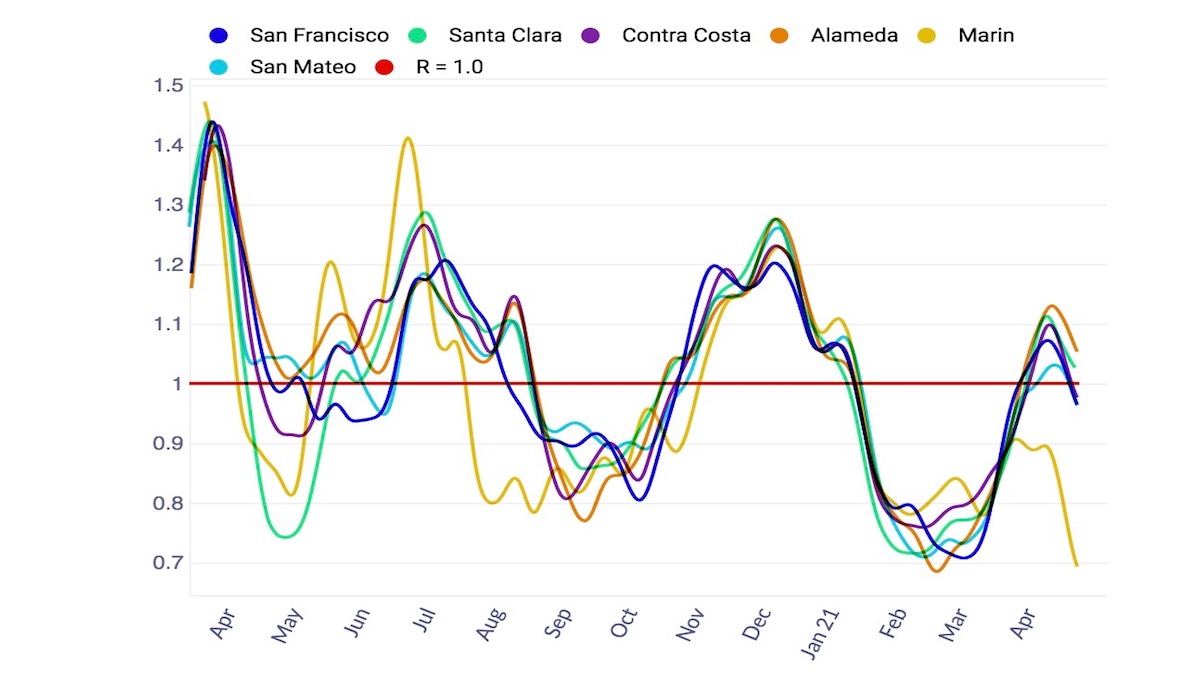
Covid-19 R Estimation has brought its estimate of the San Francisco R Number below 1 (.96) for the first time since March 24, and lowered it’s estimate for the California R Number to .93. Though most models in the ensemble have the San Francisco R Number below 1, the average ticked up to .82, while the average for California remained at .8. Note: the ensemble has kept its California R Number average estimate at or below 1 since the beginning of Februrary.
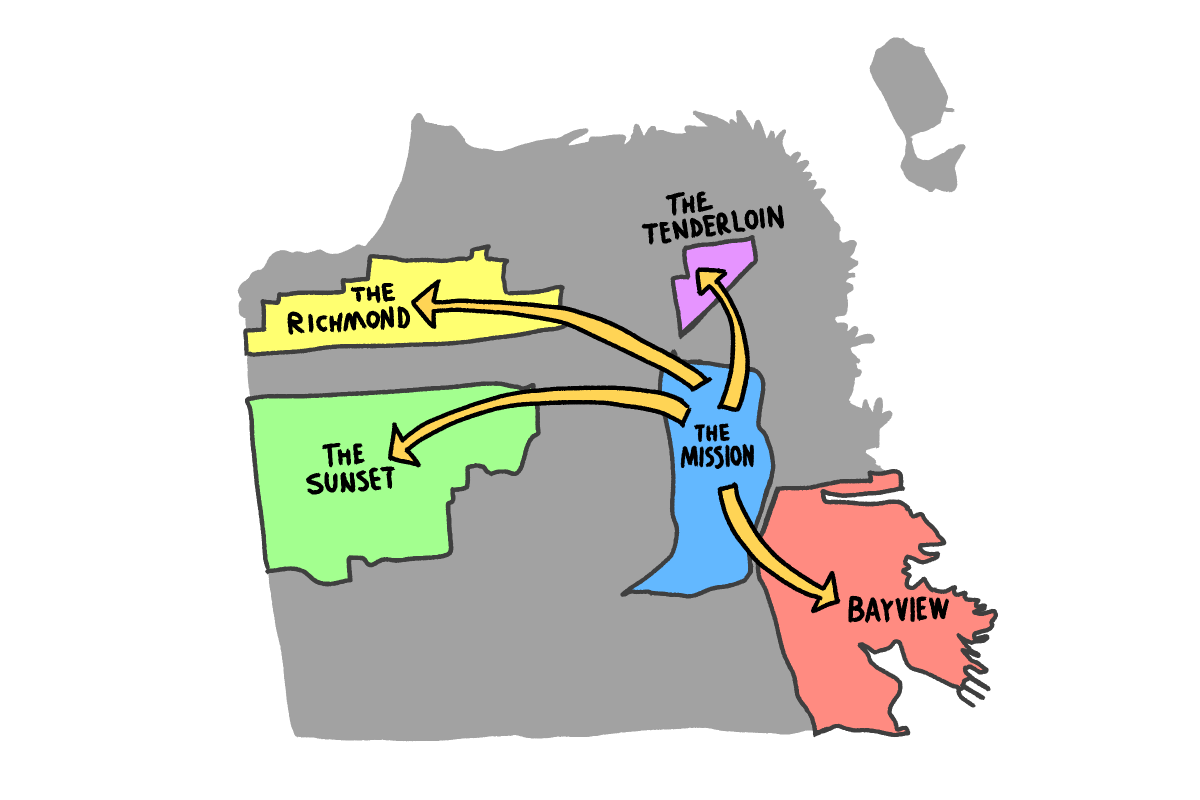
Between March 19 and April 17, DPH reported 75 new cases in the Mission, or 12.6 new cases per 10,000 residents. The Citywide rate for that period was 12.2 new cases per 10,000 residents. Since the pandemic began, Mission residents have had 4075 cases, or a case rate of 683.3 cases per 10,000 residents. Bayview Hunters Point had the highest number of cases (78) in the last month, and by a wide margin has the highest case rate in the City since the beginning (1021 cases per 10,000 residents).
For the week ending April 14, the seven-day rolling average of daily new cases in the City was 32 or 3.7 new cases per day per 100,000 residents.
As of April 17, White residents have had 37 percent of the month’s cases, while Asians have had 20 percent, Latinx 16 percent, Blacks 10 percent, Pacific Islanders 3 percent, Multi-racials 3 percent and Native Americans .4 percent.
Hospitalizations continue to fluctuate and remain below 30. Although dropping from yesterday’s totals, for the week ending April 18, the rate of weekly change in Covid positive patients rose 19 percent. During that week, the seven-day average availability of ICU beds was 35 percent and Acute Care availability was 24 percent. On April 18, DPH reports Covid patients comprised 4.2 percent of ICU occupancy and 1.4 percent of Acute Care occupancy. No, DPH still does not provide any demographic or cumulative information regarding hospitalizations.
The latest data from the Federal Health and Human Services department shows last week SFGH had 7 Covid patients, 25 percent of all Covid patients from reporting hospitals.
Between February 16 and April 17, Mission residents took 22,232 tests with a 1.29 percent positivity rate. Over that period, Tenderloin had the highest positivity rate in the City (2.16 percent) while rates in five neighborhoods including Glen Park were negligible.
Though new cases have been stable and relatively low since March, DPH reports contact tracing figures have actually gotten worse. For the two week period ending April 16, DPH reports tracers interviewed only 82 percent of positive cases and 79 percent of their contacts. Maybe they took a spring break.
Another post-Easter miracle. There were 529 deaths reported yesterday, 528 today. Although reports on Covid-related deaths have shown a sharp increase during the past couple weeks, the Mission total remains at 49. The only other neighborhoods over 40 are Excelsior (48) and Bayview Hunters Point (41). Three neighborhoods (Sunset/Parkside, Pacific Heights and Tenderloin) have 30 or more, while eighteen neighborhoods have less than 10. Presidio and Seacliff have recorded 0 Covid-related deaths.