
Good Morning, Mission! Welcome to Virus Village, your daily Covid-19 data dump.
Hospitalizations fell below 150 for the first time since December 15. Good news but not surprising given the fall in cases. Worrisome is the rising R Number.
Phoenix Data Project has an interesting insight as to why local cases have continued to fall.
It could be SF is already beginning to feel the effects of the B117 variant. Tomas Pueyo (of Hammer and Dance fame) has a new explainer out on the Variant and the Vaccines. Not much new, but a good summary, with good graphs, of the developing situation.
Vaccines are still in short supply and distribution, though improving, is still something of a mess in the U.S., and even worse in Europe. Dark Ages Donald bears some responsibility, but as Dean Baker explains, it goes far beyond his malevolent ignorance.
While there’s a global shortage of vaccines, there’s no shortage of burgers in the Mission. Herd immunity is a long way off.
Meet Gus Clark, the flower man.
Scroll down for today’s Covid numbers.
As of February 7, over 12 percent (91,307) of San Francisco residents over 18 have received one dose, while over 3 percent (24,494) have received two. On February 7, 3319 shots were delivered, nonetheless the seven day rolling average of shots per day increased to 4,343.2. The DPH goal is 10,000 shots per day.
Hospitalizations and positive test results may be falling, but the R number is clearly on the rise. Covid-19 R Estimation for California now places San Francisco’s R Number at .88, the highest in the state, while the ensemble puts it at .84.
Between January 7 and February 6, DPH reported 447 new cases in the Mission. The hardest hit zone was the area bordered by 23rd and Cesar Chavez, Valencia and South Van Ness which reported 63 new cases, for a rate of 132.7 new cases per 10,000 residents.
For the week ending February 1, the seven-day average of daily new cases fell to 135, or 15.5 new cases per day per 100,000 residents.
Though cases across the board are falling, the biggest drop so far this month has been in Latinx cases, a good sign for the City.
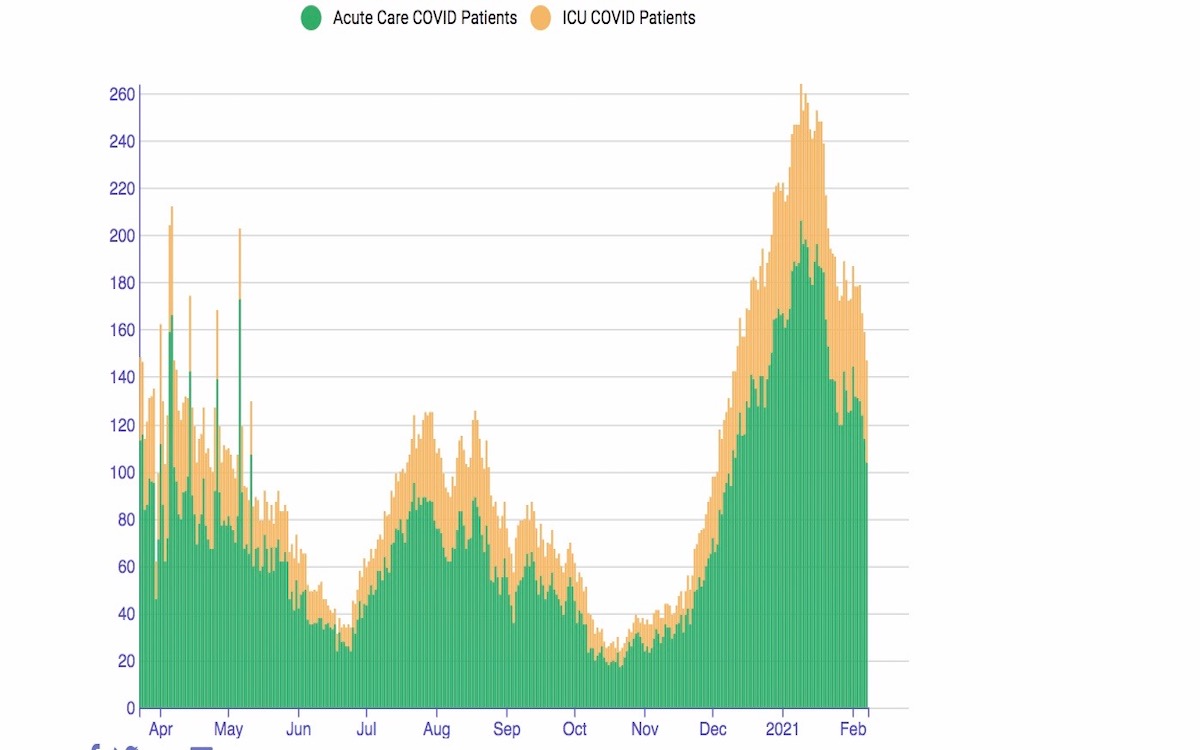
ICU cases continue to be relatively high, but total Covid Hospitalizations are down. Today’s numbers include 2 ICU transfers, and 1 Acute Care transfer. For the week ending February 7, the rate of weekly change in Covid positive patients fell 10 percent. During that week, the seven-day average availability of ICU beds was 28 percent and Acute Care availability remained 21 percent. On February 7, DPH reports 91 available ICU beds and 419 available Acute Care beds.
Recent HHS data puts 25 Covid patients at SFGH where ICU occupancy is at 99 percent with 0 ICU beds available.
In January, Latinx residents were tested 25,405 times for a rate of 191.5 per 1000 residents. Pacific Islanders had a rate of 675.6, Native Americans 490.8, Blacks 253.9, Whites 203.3, Asians 178.6 and Multi-racial 128.7 tests per 1000 residents.
The 14 day average statewide positivity rate dropped below 6 percent for the first time since November 24.
Contact tracing figures reported by DPH keep improving. For the 2 weeks ending January 29, 82 percent of those who tested positive were interviewed, and 79 percent of their contacts were reached. What has DPH learned about where outbreaks are happening?
San Francisco has 39.8 Covid related deaths per 100,000 residents. In comparison, Sacramento has 86.2, San Diego 85.4, Los Angeles 178.7, Portland 60.7, Seattle 59, Austin 64.2, San Antonio 133.6, Kansas City 122.3, Atlanta 98.3, and Tampa Bay 99.6 Covid related deaths per 100,000 residents.
@MarkRabine Thanks so much for posting this each day! Why would the R number be rising when most every other metric is falling? Thank you!!
Thanks Mark!